现代 Linux 发行版直接 pip 安装可能报 externally-managed-environment,建议用 uv、pipx 或虚拟环境;pip 安装后命令可能不在 PATH,需把 ~/.local/bin 加入 PATH;用量仓库需显式加 --warehouse 才启用,默认不持久化
Claude-Code-Usage-Monitor
Maciek-roboblogMIT更新放缓实时监控 Claude Code 的用量,预测额度消耗并在接近上限时提前告警,帮你在终端里随时掌握 token 使用情况。
Real-time Claude Code usage monitor with predictions and warnings
v4.0.0发布于 2026-06-27 09:31 UTC8,799star +3 / 7 天462fork同步于 2026-11-10 11:31 UTC
uv tool install claude-monitor
claude-monitor 硬件要求按 README 说明
README 未说明
实时监控 Claude Code 用量并预测限额,带官方 rate_limits 校验和本地用量仓库
实时监控 Claude Code 的用量,预测额度消耗并在接近上限时提前告警,帮你在终端里随时掌握 token 使用情况。
核心能力
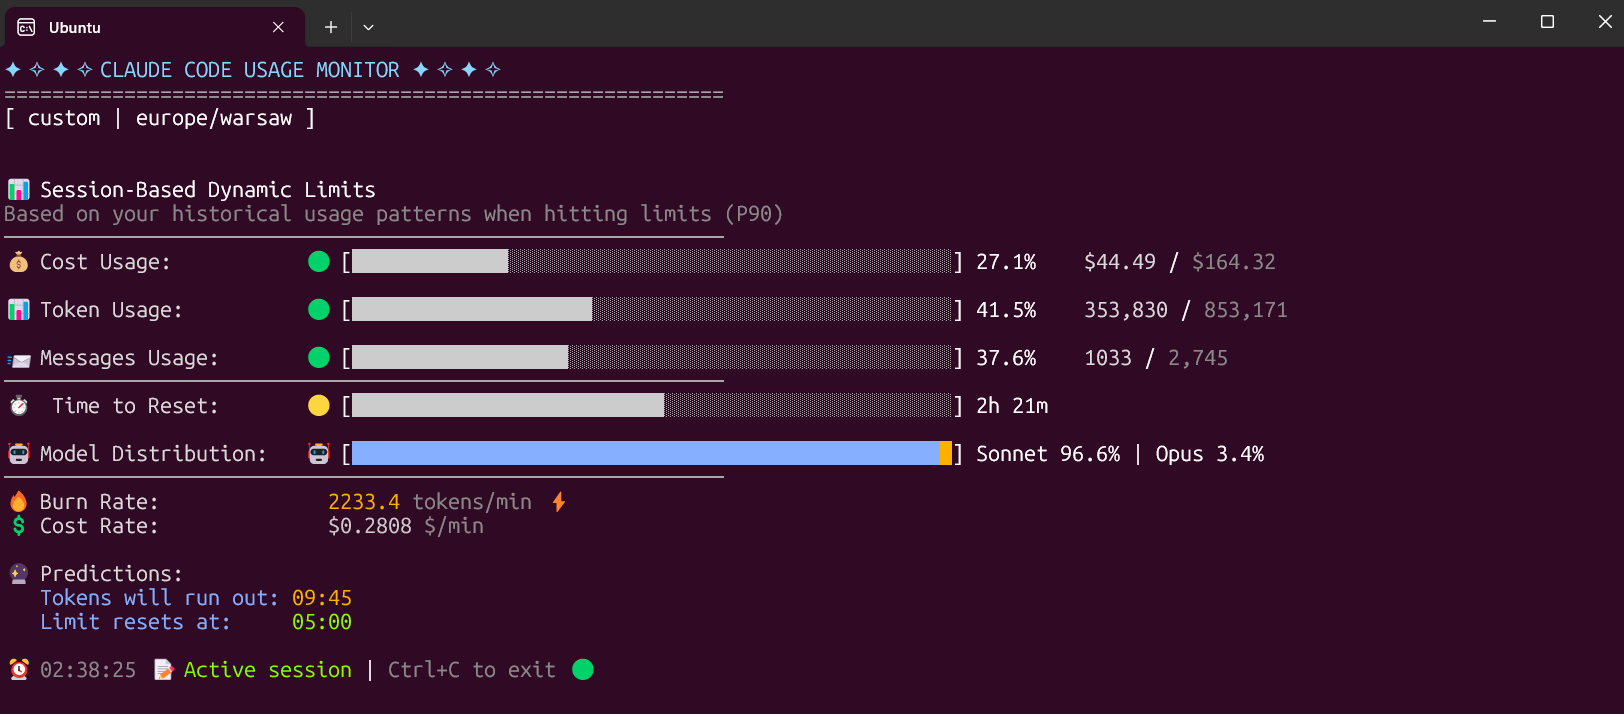
- 用 Rich 终端实时显示 token、消息数和成本用量
- 捕获官方 statusline rate_limits,过期时回退到标注的本地估算
- 为每个数字标注 official、local_estimate 等来源置信度
- 可选本地用量仓库,保留超过 Claude 30 天清理的历史
- 支持 --once、--write-state 输出机器可读快照供外部工具消费
容易踩的坑
内容由模型根据 README 生成,可能不完整或不准确,以官方文档为准。看原文 README
- v4.0.0Release v4.0.0最新正式版2026-06-27 · 2026-06-27 09:31 UTC
Bug Fixes
- Model distribution shows all families:
ModelUsageBarnow renders every model family — Sonnet, Opus, Haiku, and an "Other" bucket for anything else — instead of only Sonnet/Opus. Haiku and other models no longer vanish from the usage bar or skew the displayed percentages. (#124, #164) - Plan is now saved and restored: the selected
--planis persisted inlast_used.jsonand reloaded on the next run; an explicit--planon the command line still takes priority. (#162) - Saved theme no longer overwritten: an explicitly chosen
light/dark/classictheme is preserved across runs instead of being silently replaced by background auto-detection. (#102, #200) - Clear message on unsupported Python: running on Python older than 3.9 now prints a clear "Python 3.9+ is required" message (with a
uvinstall hint) instead of failing cryptically; the version check is now actually wired into startup and uses the documented 3.9 minimum. (#172) - Helpful "no data" diagnostic: when no Claude data directory is found, the monitor now lists the exact paths it searched and how to fix it, instead of a single terse line / blank screen. (#110)
- CLAUDE_CONFIG_DIR is honored: when set, usage data under
$CLAUDE_CONFIG_DIR/projectsis discovered (comma-separated directories supported) and checked before the standard locations; path discovery also deduplicates repeated directories. (#116) - Up-to-date, version-specific model pricing: token costs now use current Anthropic rates — Opus 4.5+ at $5/$25 (previously billed at the legacy $15/$75, a 3x overcharge), Haiku 4.5 at $1/$5, and Fable 5 at $10/$50 — while older models (Opus 3/4.0/4.1, Haiku 3/3.5) keep their original rates. (#182)
--reset-houris now actually applied: the flag was accepted and persisted but never used in any calculation. It now sets the daily rollover boundary in the daily/monthly table views, so a usage day runs fromreset_hourtoreset_hour(e.g.--reset-hour 4counts 02:00 toward the previous day) instead of midnight to midnight. It deliberately does not shift the rolling 5-hour window, whose reset comes from the session/official data. (#95, #96, #106)- Reset time prefers what Claude reported: when a session block contains a rate-limit message with a reset time, that time is shown as the reset instead of the start-plus-5h estimate, so the displayed reset matches what Claude actually told you. Official statusline limits still take precedence when available. (#114, #106)
- Epoch reset timestamps parsed in UTC: a numeric reset timestamp from a
limit reached|<epoch>message was parsed as local wall time and then mislabeled as UTC, shifting the shown reset by the host's offset on non-UTC machines (e.g. two hours off in Central Europe). Epochs are now interpreted as the absolute UTC instant they are. (#106, #220) - Windows and local timezone detection now use IANA zones: Windows auto-detection now uses
tzlocaland refuses to return rawtzutillabels such asEastern Standard Timeas if they were validpytzzones; the accepted--timezone localalias now resolves before display code runs. Added regression coverage for Istanbul reset display so reset times do not drift by an extra hour. (#188, #98, #121, #220) - Non-Anthropic models are no longer priced as Claude: a model routed through Claude Code Router (e.g. a GPT or DeepSeek model) was silently billed at the Sonnet rate, inflating reported cost. Models that are not recognizably Anthropic now report as unpriced ($0) instead of a fabricated Claude cost; unknown but clearly-Claude models still use the family fallback. (#217, #199)
- Official limits hardened against stale and malformed captures: a statusline capture older than the freshness window no longer drives the displayed reset, status, or
confidence: officiallabel (it falls back to the local estimate, flaggedstale); an official percentage drives the exit code even with no local sess
- Model distribution shows all families:
- v3.1.0Release v3.1.02025-07-23 · 2025-07-23 22:13 UTC
查看更新说明
🆕 New Features
- 📊 Usage Analysis Views: Added
--viewparameter for different time aggregation periods--view realtime(default): Live monitoring with real-time updates--view daily: Daily token usage aggregated in comprehensive table format--view monthly: Monthly token usage aggregated for long-term trend analysis
📝 Use Cases
- Daily Analysis: Track daily usage patterns and identify peak consumption periods
- Monthly Planning: Long-term budget analysis and trend identification
- Usage Optimization: Historical data analysis for better resource planning
- 📊 Usage Analysis Views: Added
- v3.0.4Release v3.0.42025-07-14 · 2025-07-14 14:06 UTC
查看更新说明
[HOTFIX] Problem with ubuntu theme
- v3.0.3Release v3.0.32025-07-14 · 2025-07-14 01:08 UTC
查看更新说明
🚨 Breaking Changes
- Package Name Change: Renamed from
claude-usage-monitortoclaude-monitor- New installation:
pip install claude-monitororuv tool install claude-monitor - New command aliases:
claude-monitorandcmonitor
- New installation:
- Python Requirement: Minimum Python version raised from 3.8 to 3.9
- Architecture Overhaul: Complete rewrite from single-file to modular package structure
- Entry Point Changes: Module execution now via
claude_monitor.__main__:main
🏗️ Complete Architectural Restructuring
- 📁 Professional Package Layout: Migrated to
src/claude_monitor/structure with proper namespace isolation- Replaced single
claude_monitor.pyfile with comprehensive modular architecture - Implemented clean separation of concerns across 8 specialized modules
- Replaced single
- 🔧 Modular Design: New package organization:
cli/- Command-line interface and bootstrap logiccore/- Business logic, models, settings, calculations, and pricingdata/- Data management, analysis, and reading utilitiesmonitoring/- Real-time session monitoring and orchestrationui/- User interface components, layouts, and display controllersterminal/- Terminal management and theme handlingutils/- Formatting, notifications, timezone, and model utilities
- ⚡ Enhanced Performance: Optimized data processing with caching, threading, and efficient session management
🎨 Rich Terminal UI System
- 💫 Rich Integration: Complete UI overhaul using Rich library for professional terminal interface
- Advanced progress bars with semantic color coding (🟢🟡🔴)
- Responsive layouts with proper terminal width handling (80+ characters required)
- Enhanced typography and visual hierarchy
- 🌈 Improved Theme System: Enhanced automatic theme detection with better contrast ratios
- 📊 Advanced Display Components: New progress visualization with burn rate indicators and time-based metrics
🔒 Type Safety and Validation
- 🛡️ Pydantic Integration: Complete type safety implementation
- Comprehensive settings validation with user-friendly error messages
- Type-safe data models (
UsageEntry,SessionBlock,TokenCounts) - CLI parameter validation with detailed feedback
- ⚙️ Smart Configuration: Pydantic-based settings with last-used parameter persistence
- 🔍 Enhanced Error Handling: Centralized error management with optional Sentry integration
📈 Advanced Analytics Features
- 🧮 P90 Percentile Calculations: Machine learning-inspired usage prediction and limit detection
- 📊 Smart Plan Detection: Auto-detection of Claude plan limits with custom plan support
- ⏱️ Real-time Monitoring: Enhanced session tracking with threading and callback systems
- 💡 Intelligent Insights: Advanced burn rate calculations and velocity indicators
🔧 Developer Experience Improvements
- 🚀 Modern Build System: Migrated from Hatchling to Setuptools with src layout
- 🧪 Comprehensive Testing: Professional test infrastructure with pytest and coverage reporting
- 📝 Enhanced Documentation: Updated troubleshooting guide with v3.0.0-specific solutions
- 🔄 CI/CD Reactivation: Restored and enhanced GitHub Actions workflows:
- Multi-Python version testing (3.9-3.12)
- Automated linting with Ruff
- Trusted PyPI publishing with OIDC
- Automated version bumping and changelog management
📦 Dependency and Packaging Updates
- 🆕 Core Dependencies Added:
pydantic>=2.0.0&pydantic-settings>=2.0.0- Type validation and settingsnumpy>=1.21.0- Advanced calculationssentry-sdk>=1.40.0- Optional error trackingpyyaml>=6.0- Configuration file support
- ⬆️ Dependency Upgrades:
rich:>=13.0.0→>=13.7.0- Enhanced UI featurespytz: No constraint →>=2023.3- Improved timezone handling
- 🛠️ Development Tools: Expanded w
- Package Name Change: Renamed from
- v3.0.2Release v3.0.22025-07-14 · 2025-07-14 00:41 UTC
查看更新说明
No specific changelog found for version 3.0.2
用户点评
登录用户的真实使用记录,可按版本和硬件筛选共 0 条
还没有人点评。第一个说出真实体验的人最有价值。
🎯 Claude Code Usage Monitor


A privacy-first Claude Usage-Ops companion for Claude Code. It combines a Rich live terminal monitor with official statusline rate_limits, machine-readable state/export output, provenance labels, forecasting, and an opt-in local usage warehouse.
📑 Table of Contents
- ✨ Key Features
- 🚀 Installation
- 📖 Usage
- 🙏 Please Help Test This Release!
- ✨ Features & How It Works
- 🚀 Usage Examples
- 🔧 Development Installation
- Troubleshooting
- 📞 Contact
- Related Tools
- 📚 Additional Documentation
- 📝 License
- 🤝 Contributors
- 🙏 Acknowledgments
✨ Key Features
🚀 v4.0.0 Major Update - Usage Ops Companion
- 🔎 Official-limit trust layer -
--statuslinecaptures Claude Code's officialrate_limits; stale or expired captures fall back to labeled local estimates. - 📦 Machine-readable protocol -
--once,--compact, and--write-stateall use one versioned snapshot builder with automation exit codes. - 🏷️ Provenance labels - exported and displayed numbers distinguish
official,local_estimate,experimental, andunknownconfidence. - 📈 Persistent usage warehouse - opt-in local history survives Claude's 30-day cleanup with project/model/day dimensions and CSV/JSON reports.
- 🧭 Forecasting and pace - reset-aware pace, date-context forecasts, official-only weekly percentages, and limit-hit freeze behavior.
- 🧩 Multi-source input -
--data-paths,CLAUDE_CONFIG_DIR, and WSL discovery can scan multiple directories without merging unrelated accounts into one 5-hour window. - 🖥️ Rich UI parity - live Rich output, rich one-shot output, compact output, state files, and exports use the same snapshot contract.
- 🧰 External companion boundary - GUIs, trays, provider adapters, and status bars should consume
--write-stateor--once --output json. - 🧪 Regression coverage - the non-integration suite now covers the trust layer, state protocol, warehouse, reports, title updates, multi-source paths, and timezone edge cases.
📋 Default Custom Plan
The Custom plan is now the default option, specifically designed for 5-hour Claude Code sessions. It monitors three critical metrics:
- Token usage - Tracks your token consumption
- Messages usage - Monitors message count
- Cost usage - The most important metric for long sessions
The Custom plan automatically adapts to your usage patterns by analyzing all your sessions from the last 192 hours (8 days) and calculating personalized limits based on your actual usage. This ensures accurate predictions and warnings tailored to your specific workflow.
🚀 Installation
⚡ Modern Installation with uv (Recommended)
Why uv is the best choice:
- ✅ Creates isolated environments automatically (no system conflicts)
- ✅ No Python version issues
- ✅ No "externally-managed-environment" errors
- ✅ Easy updates and uninstallation
- ✅ Works on all platforms
The fastest and easiest way to install and use the monitor:
Install from PyPI
# Install directly from PyPI with uv (easiest)
uv tool install claude-monitor

# Run from anywhere
claude-monitor  # or cmonitor, ccmonitor for short
Install from Source
# Clone and install from source
git clone https://github.com/Maciek-roboblog/Claude-Code-Usage-Monitor.git
cd Claude-Code-Usage-Monitor
uv tool install .

# Run from anywhere
claude-monitor
First-time uv users
If you don't have uv installed yet, get it with one command:
# On Linux/macOS:
curl -LsSf https://astral.sh/uv/install.sh | sh

# On Windows:
powershell -ExecutionPolicy ByPass -c "irm https://astral.sh/uv/install.ps1 | iex"

# After installation, restart your terminal
📦 Installation with pip
# Install from PyPI
pip install claude-monitor

# If claude-monitor command is not found, add ~/.local/bin to PATH:
echo 'export PATH="$HOME/.local/bin:$PATH"' >> ~/.bashrc
source ~/.bashrc  # or restart your terminal

# Run from anywhere
claude-monitor  # or cmonitor, ccmonitor for short
⚠️ PATH Setup: If you see WARNING: The script claude-monitor is installed in '/home/username/.local/bin' which is not on PATH, follow the export PATH command above.
⚠️ Important: On modern Linux distributions (Ubuntu 23.04+, Debian 12+, Fedora 38+), you may encounter an "externally-managed-environment" error. Instead of using --break-system-packages, we strongly recommend:
- Use uv instead (see above) - it's safer and easier
- Use a virtual environment - python3 -m venv myenv && source myenv/bin/activate
- Use pipx - pipx install claude-monitor
See the Troubleshooting section for detailed solutions.
🛠️ Other Package Managers
pipx (Isolated Environments)
# Install with pipx
pipx install claude-monitor

# Run from anywhere
claude-monitor  # or claude-code-monitor, cmonitor, ccmonitor, ccm for short
conda/mamba
# Install with pip in conda environment
pip install claude-monitor

# Run from anywhere
claude-monitor  # or cmonitor, ccmonitor for short
📖 Usage
Get Help
# Show help information
claude-monitor --help
Available Command-Line Parameters
| Parameter | Type | Default | Description |
|---|---|---|---|
| --plan | string | custom | Plan type: pro, max5, max20, team, or custom |
| --custom-limit-tokens | int | None | Token limit for custom plan (must be > 0) |
| --view | string | realtime | View type: realtime, daily, monthly, session, entries, sessions, or burn-rate |
| --output | string | rich | Output format: rich, json, text, or csv |
| --once | flag | False | Measure once, print a snapshot, and exit |
| --compact | flag | False | Single-line compact output for status bars |
| --write-state | flag | False | Write the snapshot to a state file for external tools |
| --state-file | path | None | State file path for --write-state |
| --statusline | flag | False | Run as a Claude Code statusline hook and capture official rate_limits |
| --api | flag | False | Enable the opt-in experimental Anthropic OAuth usage API |
| --data-paths | list | [] | Claude data directories to scan; repeat or comma-separate values |
| --warehouse | flag | False | Persist usage entries to the opt-in local warehouse |
| --warehouse-file | path | None | Usage warehouse file path |
| --warehouse-retention-days | int | 365 | Days of warehouse records to retain |
| --timezone | string | auto | Timezone (auto-detected). Examples: UTC, America/New_York, Europe/London |
| --time-format | string | auto | Time format: 12h, 24h, or auto |
| --theme | string | auto | Display theme: light, dark, classic, or auto |
| --refresh-rate | int | 10 | Data refresh rate in seconds (1-60) |
| --refresh-per-second | float | 0.75 | Display refresh rate in Hz (0.1-20.0) |
| --reset-hour | int | None | Daily reset hour (0-23) |
| --date-format | string | None | Date format for daily/monthly table periods |
| --abbreviate-tokens | flag | False | Abbreviate token counts in table views |
| --sparklines | flag | False | Show opt-in sparklines in table views |
| --filter-models | string | all | Use all models, or anthropic to exclude routed non-Claude models |
| --set-terminal-title | flag | False | Set the terminal title from the usage snapshot |
| --title-format | string | "{pct}% {plan}" | Terminal title template using pct, plan, used, limit, cost, reset |
| --hide-model-distribution | flag | False | Hide the model distribution bar |
| --no-header | flag | False | Hide the header banner |
| --no-emoji | flag | False | Render plain output without emoji |
| --log-level | string | INFO | Logging level: DEBUG, INFO, WARNING, ERROR, CRITICAL |
| --log-file | path | None | Log file path |
| --debug | flag | False | Enable debug logging |
| --version, -v | flag | False | Show version information |
| --clear | flag | False | Clear saved configuration |
Plan Options
| Plan | Token Limit | Cost Limit | Description |
|---|---|---|---|
| pro | 19,000 | $18.00 | Claude Pro subscription |
| max5 | 88,000 | $35.00 | Claude Max5 subscription |
| max20 | 220,000 | $140.00 | Claude Max20 subscription |
| team | estimate | unverified | Team label; prefer official statusline or --plan custom |
| custom | P90-based | (default) $50.00 | Auto-detection with ML analysis |
Command Aliases
The tool can be invoked using any of these commands:
- claude-monitor (primary)
- claude-code-monitor (full name)
- cmonitor (short)
- ccmonitor (short alternative)
- ccm (shortest)
Save Flags Feature
The monitor automatically saves your preferences to avoid re-specifying them on each run:
What Gets Saved:
- View type (--view)
- Plan (--plan)
- Theme preferences (--theme)
- Timezone settings (--timezone)
- Time format (--time-format)
- Refresh rates (--refresh-rate, --refresh-per-second)
- Reset hour (--reset-hour)
- Custom token limits (--custom-limit-tokens)
Configuration Location: ~/.claude-monitor/last_used.json
Usage Examples:
# First run - specify preferences
claude-monitor --plan pro --theme dark --timezone "America/New_York"

# Subsequent runs - preferences automatically restored
claude-monitor --plan pro

# Override saved settings for this session
claude-monitor --plan pro --theme light

# Clear all saved preferences
claude-monitor --clear
Key Features:
- ✅ Automatic parameter persistence between sessions
- ✅ CLI arguments always override saved settings
- ✅ Atomic file operations prevent corruption
- ✅ Graceful fallback if config files are damaged
- ✅ Plan is saved and restored between sessions (override any time with
--plan) - ✅ An explicitly chosen theme is kept and not overwritten by auto-detection
Basic Usage
With uv tool installation (Recommended)
# Default (Custom plan with auto-detection)
claude-monitor

# Alternative commands
claude-code-monitor  # Full descriptive name
cmonitor             # Short alias
ccmonitor            # Short alternative
ccm                  # Shortest alias

# Exit the monitor
# Press Ctrl+C to gracefully exit
Development mode
If running from source, use python -m claude_monitor from the src/ directory.
Machine-readable Usage Protocol
Use these surfaces when another tool needs current usage without scraping the Rich TUI:
# One-shot JSON snapshot with source/confidence/provenance fields
claude-monitor --once --output json

# Compact one-line status output
claude-monitor --once --compact

# Keep an atomically-written state file up to date for status bars and dashboards
claude-monitor --write-state --state-file ~/.claude-monitor/state/latest.json

# Install as a Claude Code statusline hook to capture official rate_limits
claude-monitor --statusline
--once exits with automation-friendly codes: 0 ok, 10 near limit, 11 limit hit, 20 indeterminate/no active session, and 30 no data or config error. When official statusline data is fresh it wins; otherwise the snapshot falls back to a labeled local estimate.
Persistent Usage Warehouse
The warehouse is opt-in and local-only. It stores versioned records by source, account, project, model, and day so history can outlive Claude's 30-day cleanup.
# Start persisting usage locally
claude-monitor --warehouse

# Export warehouse-backed entries as JSON
claude-monitor --warehouse --view entries --output json

# Export session percentiles and burn-rate reports as CSV
claude-monitor --warehouse --view sessions --output csv
claude-monitor --warehouse --view burn-rate --output csv
Configuration Options
Specify Your Plan
# Custom plan with P90 auto-detection (Default)
claude-monitor --plan custom

# Pro plan (~44,000 tokens)
claude-monitor --plan pro

# Max5 plan (~88,000 tokens)
claude-monitor --plan max5

# Max20 plan (~220,000 tokens)
claude-monitor --plan max20

# Custom plan with explicit token limit
claude-monitor --plan custom --custom-limit-tokens 100000
Custom Reset Times
# Reset at 3 AM
claude-monitor --reset-hour 3

# Reset at 10 PM
claude-monitor --reset-hour 22
Usage View Configuration
# Real-time monitoring with live updates (Default)
claude-monitor --view realtime

# Daily token usage aggregated in table format
claude-monitor --view daily

# Monthly token usage aggregated in table format
claude-monitor --view monthly
Performance and Display Configuration
# Adjust refresh rate (1-60 seconds, default: 10)
claude-monitor --refresh-rate 5

# Adjust display refresh rate (0.1-20 Hz, default: 0.75)
claude-monitor --refresh-per-second 1.0

# Set time format (auto-detected by default)
claude-monitor --time-format 24h  # or 12h

# Force specific theme
claude-monitor --theme dark  # light, dark, classic, auto

# Clear saved configuration
claude-monitor --clear
Timezone Configuration
The default timezone is auto-detected from your system. Override with any valid timezone:
# Use US Eastern Time
claude-monitor --timezone America/New_York

# Use Tokyo time
claude-monitor --timezone Asia/Tokyo

# Use UTC
claude-monitor --timezone UTC

# Use London time
claude-monitor --timezone Europe/London
Logging and Debugging
# Enable debug logging
claude-monitor --debug

# Log to file
claude-monitor --log-file ~/.claude-monitor/logs/monitor.log

# Set log level
claude-monitor --log-level WARNING  # DEBUG, INFO, WARNING, ERROR, CRITICAL
Available Plans
| Plan | Token Limit | Best For |
|---|---|---|
| custom | P90 auto-detect | Intelligent limit detection (default) |
| pro | ~19,000 | Claude Pro subscription |
| max5 | ~88,000 | Claude Max5 subscription |
| max20 | ~220,000 | Claude Max20 subscription |
Advanced Plan Features
- P90 Analysis: Custom plan uses 90th percentile calculations from your usage history
- Cost Tracking: Model-specific pricing with cache token calculations
- Limit Detection: Intelligent threshold detection with 95% confidence
🚀 What's New in v4.0.0
Major Changes
Usage Ops Companion
- Official Claude Code statusline
rate_limitsare treated as the live source of truth when fresh. - Every non-official number is labeled by provenance and confidence instead of being rendered as truth.
- Machine consumers get one stable snapshot contract through
--once,--compact, and--write-state. - Opt-in warehouse reports expose durable history, percentiles, burn-rate rows, and estimate-labeled plan recommendations.
Enhanced Functionality
- Pace and Forecast: Reset-aware pace labels, date-context forecasts, and limit-hit freeze behavior.
- Official Weekly: Seven-day percentages render only from official statusline data.
- Multi-source Paths: Multiple Claude data directories are deduplicated and source/account tagged.
- Cost Analytics: Current Anthropic pricing, cache token support, and unknown pricing for non-Anthropic routed models.
New CLI Options
--statusline: Capture official Claude Coderate_limits.--once,--compact,--output json|text|csv: Script-friendly snapshot/report output.--write-state,--state-file: Atomic state files for companion tools.--warehouse,--warehouse-file,--warehouse-retention-days: Durable local usage history.--data-paths: Scan multiple Claude data directories without collapsing them.--filter-models anthropic: Exclude routed non-Claude models from Claude limit math.--set-terminal-title,--title-format: Snapshot-based terminal title updates.--no-header,--no-emoji,--hide-model-distribution: Glanceable display controls.
Breaking Changes
- v4 formalizes the snapshot schema and trust-layer semantics for companion tools.
- Package name remains
claude-monitor; Python 3.9+ is still required.
✨ Features & How It Works
v4.0.0 Architecture Overview
The new version features a complete rewrite with modular architecture following Single Responsibility Principle (SRP):
🖥️ User Interface Layer
| Component | Description |
|---|---|
| CLI Module | Pydantic-based |
| Settings/Config | Type-safe |
| Error Handling | Sentry-ready |
| Rich Terminal UI | Adaptive Theme |
🎛️ Monitoring Orchestrator
| Component | Key Responsibilities |
|---|---|
| Central Control Hub | Session Mgmt · Real-time Data Flow · Component Coordination |
| Data Manager | Cache Mgmt · File I/O · State Persist |
| Session Monitor | Real-time · 5 hr Windows · Token Track |
| UI Controller | Rich Display · Progress Bars · Theme System |
| Analytics | P90 Calculator · Burn Rate · Predictions |
🏗️ Foundation Layer
| Component | Core Features |
|---|---|
| Core Models | Session Data · Config Schema · Type Safety |
| Analysis Engine | ML Algorithms · Statistical · Forecasting |
| Terminal Themes | Auto-detection · WCAG Colors · Contrast Opt |
| Claude API Data | Token Tracking · Cost Calculator · Session Blocks |
🔄 Data Flow: Claude Config Files → Data Layer → Analysis Engine → UI Components → Terminal Display
Current Features
🔄 Advanced Real-time Monitoring
- Configurable update intervals (1-60 seconds)
- High-precision display refresh (0.1-20 Hz)
- Intelligent change detection to minimize CPU usage
- Multi-threaded orchestration with callback system
📊 Rich UI Components
- Progress Bars: WCAG-compliant color schemes with scientific contrast ratios
- Data Tables: Sortable columns with model-specific statistics
- Layout Manager: Responsive design that adapts to terminal size
- Theme System: Auto-detects terminal background for optimal readability
📈 Multiple Usage Views
- Realtime View (Default): Live monitoring with progress bars, current session data, and burn rate analysis
- Daily View: Aggregated daily statistics showing Date, Models, Input/Output/Cache tokens, Total tokens, and Cost
- Monthly View: Monthly aggregated data for long-term trend analysis and budget planning
🔮 Machine Learning Predictions
- P90 Calculator: 90th percentile analysis for intelligent limit detection
- Burn Rate Analytics: Multi-session consumption pattern analysis
- Cost Projections: Model-specific pricing with cache token calculations
- Session Forecasting: Predicts when sessions will expire based on usage patterns
🤖 Intelligent Auto-Detection
- Background Detection: Automatically determines terminal theme (light/dark)
- System Integration: Auto-detects timezone and time format preferences
- Plan Recognition: Analyzes usage patterns to suggest optimal plans
- Limit Discovery: Scans historical data to find actual token limits
Understanding Claude Sessions
How Claude Code Sessions Work
Claude Code operates on a 5-hour rolling session window system:
- Session Start: Begins with your first message to Claude
- Session Duration: Lasts exactly 5 hours from that first message
- Token Limits: Apply within each 5-hour session window
- Multiple Sessions: Can have several active sessions simultaneously
- Rolling Windows: New sessions can start while others are still active
Session Reset Schedule
Example Session Timeline: 10:30 AM - First message (Session A starts at 10 AM) 03:00 PM - Session A expires (5 hours later)
12:15 PM - First message (Session B starts 12PM) 05:15 PM - Session B expires (5 hours later 5PM)
Burn Rate Calculation
The monitor calculates burn rate using sophisticated analysis:
- Data Collection: Gathers token usage from all sessions in the last hour
- Pattern Analysis: Identifies consumption trends across overlapping sessions
- Velocity Tracking: Calculates tokens consumed per minute
- Prediction Engine: Estimates when current session tokens will deplete
- Real-time Updates: Adjusts predictions as usage patterns change
Token Limits by Plan
v4.0.0 Plan Limits and Labels
| Plan | Limit (Tokens) | Cost Limit | Messages | Algorithm |
|---|---|---|---|---|
| Claude Pro | 19,000 | $18.00 | 250 | Fixed local estimate |
| Claude Max5 | 88,000 | $35.00 | 1,000 | Fixed limit |
| Claude Max20 | 220,000 | $140.00 | 2,000 | Fixed limit |
| Claude Team | estimate | unverified | unknown | Label only; use statusline or custom |
| Custom | P90-based | (default) $50.00 | 250+ | Machine learning |
Advanced Limit Detection
- P90 Analysis: Uses 90th percentile of your historical usage
- Confidence Threshold: 95% accuracy in limit detection
- Cache Support: Includes cache creation and read token costs
- Model-Specific: Adapts to Claude 3.5, Claude 4, and future models
Technical Requirements
Dependencies (v4.0.0)
# Core dependencies (automatically installed)
pytz>=2023.3                # Timezone handling
rich>=13.7.0                # Rich terminal UI
pydantic>=2.0.0             # Type validation
pydantic-settings>=2.0.0    # Configuration management
numpy>=1.21.0               # Statistical calculations
pyyaml>=6.0                 # Configuration files
tomli>=1.2.0                # pyproject fallback on Python <3.11
tzdata                      # Windows timezone data
tzlocal>=5.0                # Windows local timezone to IANA resolver
wcwidth>=0.2.13             # Terminal display-width calculation
Python Requirements
- Minimum: Python 3.9+
- Recommended: Python 3.11+
- Tested on: Python 3.9, 3.10, 3.11, 3.12, 3.13
Smart Detection Features
Automatic Plan Switching
When using the default Pro plan:
- Detection: Monitor notices token usage exceeding 7,000
- Analysis: Scans previous sessions for actual limits
- Switch: Automatically changes to custom_max mode
- Notification: Displays clear message about the change
- Continuation: Keeps monitoring with new, higher limit
Limit Discovery Process
The auto-detection system:
- Scans History: Examines all available session blocks
- Finds Peaks: Identifies highest token usage achieved
- Validates Data: Ensures data quality and recency
- Sets Limits: Uses discovered maximum as new limit
- Learns Patterns: Adapts to your actual usage capabilities
🚀 Usage Examples
Common Scenarios
🌅 Morning Developer
Scenario: You start work at 9 AM and want tokens to reset aligned with your schedule.
# Set custom reset time to 9 AM
./claude_monitor.py --reset-hour 9

# With your timezone
./claude_monitor.py --reset-hour 9 --timezone US/Eastern
Benefits:
- Reset times align with your work schedule
- Better planning for daily token allocation
- Predictable session windows
🌙 Night Owl Coder
Scenario: You often work past midnight and need flexible reset scheduling.
# Reset at midnight for clean daily boundaries
./claude_monitor.py --reset-hour 0

# Late evening reset (11 PM)
./claude_monitor.py --reset-hour 23
Strategy:
- Plan heavy coding sessions around reset times
- Use late resets to span midnight work sessions
- Monitor burn rate during peak hours
🔄 Heavy User with Variable Limits
Scenario: Your token limits seem to change, and you're not sure of your exact plan.
# Auto-detect your highest previous usage
claude-monitor --plan custom_max

# Monitor with custom scheduling
claude-monitor --plan custom_max --reset-hour 6
Approach:
- Let auto-detection find your real limits
- Monitor for a week to understand patterns
- Note when limits change or reset
🌍 International User
Scenario: You're working across different timezones or traveling.
# US East Coast
claude-monitor --timezone America/New_York

# Europe
claude-monitor --timezone Europe/London

# Asia Pacific
claude-monitor --timezone Asia/Singapore

# UTC for international team coordination
claude-monitor --timezone UTC --reset-hour 12
⚡ Quick Check
Scenario: You just want to see current status without configuration.
# Just run it with defaults
claude-monitor

# Press Ctrl+C after checking status
📊 Usage Analysis Views
Scenario: Analyzing your token usage patterns over different time periods.
# View daily usage breakdown with detailed statistics
claude-monitor --view daily

# Analyze monthly token consumption trends
claude-monitor --view monthly --plan max20

# Export daily usage data to log file for analysis
claude-monitor --view daily --log-file ~/daily-usage.log

# Review usage in different timezone
claude-monitor --view daily --timezone America/New_York
Use Cases:
- Realtime: Live monitoring of current session and burn rate
- Daily: Analyze daily consumption patterns and identify peak usage days
- Monthly: Long-term trend analysis and monthly budget planning
Plan Selection Strategies
How to Choose Your Plan
Start with Default (Recommended for New Users)
# Pro plan detection with auto-switching
claude-monitor
- Monitor will detect if you exceed Pro limits
- Automatically switches to custom_max if needed
- Shows notification when switching occurs
Known Subscription Users
# If you know you have Max5
claude-monitor --plan max5

# If you know you have Max20
claude-monitor --plan max20
Unknown Limits
# Auto-detect from previous usage
claude-monitor --plan custom_max
Best Practices
Setup Best Practices
- Start Early in Sessions
   # Begin monitoring when starting Claude work (uv installation)
   claude-monitor

   # Or development mode
   ./claude_monitor.py
- Gives accurate session tracking from the start
- Better burn rate calculations
- Early warning for limit approaches
- Use Modern Installation (Recommended)
   # Easy installation and updates with uv
   uv tool install claude-monitor
   claude-monitor --plan max5
- Clean system installation
- Easy updates and maintenance
- Available from anywhere
- Custom Shell Alias (Legacy Setup)
   # Add to ~/.bashrc or ~/.zshrc (only for development setup)
   alias claude-monitor='cd ~/Claude-Code-Usage-Monitor && source venv/bin/activate && ./claude_monitor.py'
Usage Best Practices
-
Monitor Burn Rate Velocity
- Watch for sudden spikes in token consumption
- Adjust coding intensity based on remaining time
- Plan big refactors around session resets
-
Strategic Session Planning
   # Plan heavy usage around reset times
   claude-monitor --reset-hour 9
- Schedule large tasks after resets
- Use lighter tasks when approaching limits
- Leverage multiple overlapping sessions
- Timezone Awareness
   # Always use your actual timezone
   claude-monitor --timezone Europe/Warsaw
- Accurate reset time predictions
- Better planning for work schedules
- Correct session expiration estimates
Optimization Tips
-
Terminal Setup
- Use terminals with at least 80 character width
- Enable color support for better visual feedback (check COLORTERM environment variable)
- Consider dedicated terminal window for monitoring
- Use terminals with truecolor support for best theme experience
-
Workflow Integration
   # Start monitoring with your development session (uv installation)
   tmux new-session -d -s claude-monitor 'claude-monitor'

   # Or development mode
   tmux new-session -d -s claude-monitor './claude_monitor.py'

   # Check status anytime
   tmux attach -t claude-monitor
- Multi-Session Strategy
- Remember sessions last exactly 5 hours
- You can have multiple overlapping sessions
- Plan work across session boundaries
Real-World Workflows
Large Project Development
# Setup for sustained development
claude-monitor --plan max20 --reset-hour 8 --timezone America/New_York
Daily Routine:
- 8:00 AM: Fresh tokens, start major features
- 10:00 AM: Check burn rate, adjust intensity
- 12:00 PM: Monitor for afternoon session planning
- 2:00 PM: New session window, tackle complex problems
- 4:00 PM: Light tasks, prepare for evening session
Learning & Experimentation
# Flexible setup for learning
claude-monitor --plan pro
Sprint Development
# High-intensity development setup
claude-monitor --plan max20 --reset-hour 6
🔧 Development Installation
For contributors and developers who want to work with the source code:
Quick Start (Development/Testing)
# Clone the repository
git clone https://github.com/Maciek-roboblog/Claude-Code-Usage-Monitor.git
cd Claude-Code-Usage-Monitor

# Install in development mode
pip install -e .

# Run from source
python -m claude_monitor
v4.0.0 Testing Features
The new version includes a comprehensive test suite:
- 700+ non-integration tests across the snapshot, trust-layer, warehouse, UI, and timezone paths
- Unit tests for all components
- Integration tests for end-to-end workflows
- Performance tests with benchmarking
- Mock objects for isolated testing
# Run tests
cd src/
python -m pytest

# Run with coverage
python -m pytest --cov=claude_monitor --cov-report=html

# Run specific test modules
python -m pytest tests/test_analysis.py -v
Prerequisites
- Python 3.9+ installed on your system
- Git for cloning the repository
Virtual Environment Setup
Why Use Virtual Environment?
Using a virtual environment is strongly recommended because:
- 🛡️ Isolation: Keeps your system Python clean and prevents dependency conflicts
- 📦 Portability: Easy to replicate the exact environment on different machines
- 🔄 Version Control: Lock specific versions of dependencies for stability
- 🧹 Clean Uninstall: Simply delete the virtual environment folder to remove everything
- 👥 Team Collaboration: Everyone uses the same Python and package versions
Installing virtualenv (if needed)
If you don't have venv module available:
# Ubuntu/Debian
sudo apt-get update
sudo apt-get install python3-venv

# Fedora/RHEL/CentOS
sudo dnf install python3-venv

# macOS (usually comes with Python)
# If not available, install Python via Homebrew:
brew install python3

# Windows (usually comes with Python)
# If not available, reinstall Python from python.org
# Make sure to check "Add Python to PATH" during installation
Alternatively, use the virtualenv package:
# Install virtualenv via pip
pip install virtualenv

# Then create virtual environment with:
virtualenv venv
# instead of: python3 -m venv venv
Step-by-Step Setup
# 1. Clone the repository
git clone https://github.com/Maciek-roboblog/Claude-Code-Usage-Monitor.git
cd Claude-Code-Usage-Monitor

# 2. Create virtual environment
python3 -m venv venv
# Or if using virtualenv package:
# virtualenv venv

# 3. Activate virtual environment
# On Linux/Mac:
source venv/bin/activate
# On Windows:
# venv\Scripts\activate

# 4. Install Python dependencies
pip install pytz
pip install rich>=13.0.0
# 5. Make script executable (Linux/Mac only)
chmod +x claude_monitor.py

# 6. Run the monitor
python claude_monitor.py
Daily Usage
After initial setup, you only need:
# Navigate to project directory
cd Claude-Code-Usage-Monitor

# Activate virtual environment
source venv/bin/activate  # Linux/Mac
# venv\Scripts\activate   # Windows

# Run monitor
./claude_monitor.py  # Linux/Mac
# python claude_monitor.py  # Windows

# When done, deactivate
deactivate
Pro Tip: Shell Alias
Create an alias for quick access:
# Add to ~/.bashrc or ~/.zshrc
alias claude-monitor='cd ~/Claude-Code-Usage-Monitor && source venv/bin/activate && ./claude_monitor.py'

# Then just run:
claude-monitor
Troubleshooting
Installation Issues
"externally-managed-environment" Error
On modern Linux distributions (Ubuntu 23.04+, Debian 12+, Fedora 38+), you may encounter:
error: externally-managed-environment
× This environment is externally managed
Solutions (in order of preference):
- Use uv (Recommended)
   # Install uv first
   curl -LsSf https://astral.sh/uv/install.sh | sh

   # Then install with uv
   uv tool install claude-monitor
- Use pipx (Isolated Environment)
   # Install pipx
   sudo apt install pipx  # Ubuntu/Debian
   # or
   python3 -m pip install --user pipx

   # Install claude-monitor
   pipx install claude-monitor
- Use virtual environment
   python3 -m venv myenv
   source myenv/bin/activate
   pip install claude-monitor
- Force installation (Not Recommended)
pip install --user claude-monitor --break-system-packages
⚠️ Warning: This bypasses system protection and may cause conflicts. We strongly recommend using a virtual environment instead.
Command Not Found After pip Install
If claude-monitor command is not found after pip installation:
- Check if it's a PATH issue
   # Look for the warning message during pip install:
   # WARNING: The script claude-monitor is installed in '/home/username/.local/bin' which is not on PATH
- Add to PATH
   # Add this to ~/.bashrc or ~/.zshrc
   echo 'export PATH="$HOME/.local/bin:$PATH"' >> ~/.bashrc

   # Reload shell
   source ~/.bashrc  # or source ~/.zshrc
- Verify installation location
   # Find where pip installed the script
   pip show -f claude-monitor | grep claude-monitor
- Run directly with Python
python3 -m claude_monitor
Python Version Conflicts
If you have multiple Python versions:
- Check Python version
   python3 --version
   pip3 --version
- Use specific Python version
   python3.11 -m pip install claude-monitor
   python3.11 -m claude_monitor
- Use uv (handles Python versions automatically)
uv tool install claude-monitor
Runtime Issues
No active session found
If you encounter the error No active session found, please follow these steps:
-
Initial Test: Launch Claude Code and send at least two messages. In some cases, the session may not initialize correctly on the first attempt, but it resolves after a few interactions.
-
Configuration Path: If the issue persists, consider specifying a custom configuration path. By default, Claude Code uses ~/.config/claude. You may need to adjust this path depending on your environment.
CLAUDE_CONFIG_DIR=~/.config/claude ./claude_monitor.py
Related Tools
Claude Monitor stays a CLI-first, privacy-first core. GUIs, tray apps, hardware
dashboards, and provider adapters belong in separate repositories; they should
consume the state/export protocol through --write-state or
--once --output json instead of parsing the Rich TUI or reimplementing the
analyzer.
# Long-running file for status bars, tray apps, and dashboards
claude-monitor --write-state --state-file ~/.claude-monitor/state/latest.json

# One-shot JSON for hooks and scripts
claude-monitor --once --output json
Companion Displays
- Headroom: menu bar companion that reads Claude Code statusline output and focuses on official 5-hour and 7-day utilization.
- claude-statusbar: lightweight status bar display for terminal and IDE integrations.
- claude-monitor-cyd: ESP32 physical dashboard for local usage telemetry.
- Claude Code Usage Tracker: desktop usage tracker inspired by this project.
- Native menu bar and system tray apps are welcome as separate companion projects that consume the state file; they are not bundled into this Python package.
Provider and Adapter Boundary
Claude Monitor's built-in limit window is the Claude Code subscription quota.
OpenCode, LiteLLM, Gemini/Qwen, z.ai, Bedrock, and other provider data should be
modeled as separate source adapters with their own source.kind. Adapters should
default to Claude Code data unless the user explicitly selects another source,
and they must not auto-merge OpenCode/API/provider entries into the Claude
5-hour subscription window.
For Cursor and Claude Desktop there is no local usage/limit signal comparable to
Claude Code's JSONL logs or statusline rate_limits, so they are out of scope
for built-in live limit tracking unless such a signal becomes available.
📞 Contact
Have questions, suggestions, or want to collaborate? Feel free to reach out!
📧 Email: [email protected]
Whether you need help with setup, have feature requests, found a bug, or want to discuss potential improvements, don't hesitate to get in touch. I'm always happy to help and hear from users of the Claude Code Usage Monitor!
📚 Additional Documentation
- Development Roadmap - ML features, PyPI package, Docker plans
- Contributing Guide - How to contribute, development guidelines
- Troubleshooting - Common issues and solutions
📝 License
MIT License - feel free to use and modify as needed.
🤝 Contributors
Want to contribute? Check out our Contributing Guide!
🙏 Acknowledgments
Sponsors
A special thanks to our supporters who help keep this project going:
Ed - Buy Me Coffee Supporter
"I appreciate sharing your work with the world. It helps keep me on track with my day. Quality readme, and really good stuff all around!"
Star History
⭐ Star this repo if you find it useful! ⭐
terminal
microsoft·C++
微软官方的新版 Windows Terminal 终端模拟器,同时包含原版 Windows 控制台宿主,支持多标签、GPU 加速渲染和 WSL,替代老旧的 cmd 窗口。
终端模拟器+4终端模拟器
105363+289.7kv1.25.2733.02026-11-09 23:18 UTC

tabby
Eugeny·TypeScript
一款基于 TypeScript 的现代终端模拟器,支持 SSH、Telnet、串口连接,提供插件扩展和主题定制,适合替代传统终端工具。
终端模拟器+4终端模拟器
75362+444.3kv1.0.2382026-11-06 04:03 UTC
alacritty
alacritty·Rust
用 Rust 写的跨平台 GPU 加速终端模拟器,基于 OpenGL 渲染,主打高帧率和低延迟,适合嫌普通终端卡顿、想要更顺滑操作体验的开发者。
终端模拟器+4终端模拟器
66149+253.7kv0.17.02026-11-06 21:34 UTC

termux-app
termux·Java
在 Android 手机上提供完整的 Linux 终端环境,通过安装各类软件包把手机变成便携开发机。
终端模拟器+3终端模拟器
64538+2428.3kv0.118.32026-11-05 09:38 UTC