- 交互式调试 C/C++ 程序时反复停下来看栈帧、寄存器、源码:每次断点命中自动重绘,省掉手敲 bt/info registers/list 的循环,裸 GDB 或 lldb 得自己拼
- 在 SSH 连着的远端机器上排查崩溃:单文件 .gdbinit 拷过去就生效,不需要装插件管理器或改 GDB 构建,比 gdb 的 TUI 模式更可控
- 需要同时盯源码、汇编、寄存器、线程列表的底层问题:模块化面板可以按需开关,比 TUI 的固定分屏灵活
- 教学或结对调试时把状态摊在一屏上:旁观者不用跟着操作者的命令历史才能理解当前上下文
专家点评
上手难度:入门更新于 2026-11-11把 GDB 从逐条敲命令变成一屏看全状态的调试面板,替代裸 GDB 的 info 命令流
适用场景
踩坑
- 布局和尺寸调整是 issue 里反复被提的一类问题(面板挪位置、放大某个模块、源码输出到另一个终端占满宽度),说明默认布局不一定贴合你的终端和习惯,得准备读 .gdbinit 里的 Python 配置段自己改
- 语法高亮依赖额外 pip 安装 Pygments,且在 venv 环境下有专门的 issue 问怎么让 Source 模块高亮生效——如果你的 Python 环境是隔离的,GDB 内嵌解释器未必看得到你 pip 装的那个包
- 把 .gdbinit 直接覆盖到 ~ 会顶掉你已有的 GDB 配置;README 的安装方式是一行 wget 到主目录,已有 .gdbinit 的人需要手动合并
同类对比
GDB 自带的 TUI 模式(layout src/asm)零安装但布局固定;想要更完整的调试前端可以看 gdbgui 或 DDD 这类图形界面,代价是失去纯终端和远端 SSH 场景的便利
wget -P ~ https://github.com/cyrus-and/gdb-dashboard/raw/master/.gdbinit
pip install pygments 硬件要求按 README 说明
README 未说明
项目说明
由 README 自动翻译提炼一个用 Python API 写的 .gdbinit 文件,为 GDB 提供模块化界面,减少查看程序状态所需的命令
给 GDB 加一个模块化可视化面板,调试时自动分屏显示源码、汇编、寄存器、栈和断点等信息,省去反复敲命令。
核心能力
- 以单个 .gdbinit 文件形式独立运行
- 用 Python API 实现模块化调试信息面板
- 程序每次停下时自动显示 dashboard
- 不重定义任何 GDB 命令,功能集中在 dashboard 命令
- 可选安装 Pygments 启用语法高亮
容易踩的坑
需把 .gdbinit 放到用户主目录才会自动生效;语法高亮需额外 pip 安装 Pygments;所有功能通过 dashboard 命令使用,原有 GDB 命令未被重定义
内容由模型根据 README 生成,可能不完整或不准确,以官方文档为准。看原文 README
暂无 release 数据(可能没有发版,或尚未同步)。
用户点评
登录用户的真实使用记录,可按版本和硬件筛选共 0 条
还没有人点评。第一个说出真实体验的人最有价值。
GDB dashboard
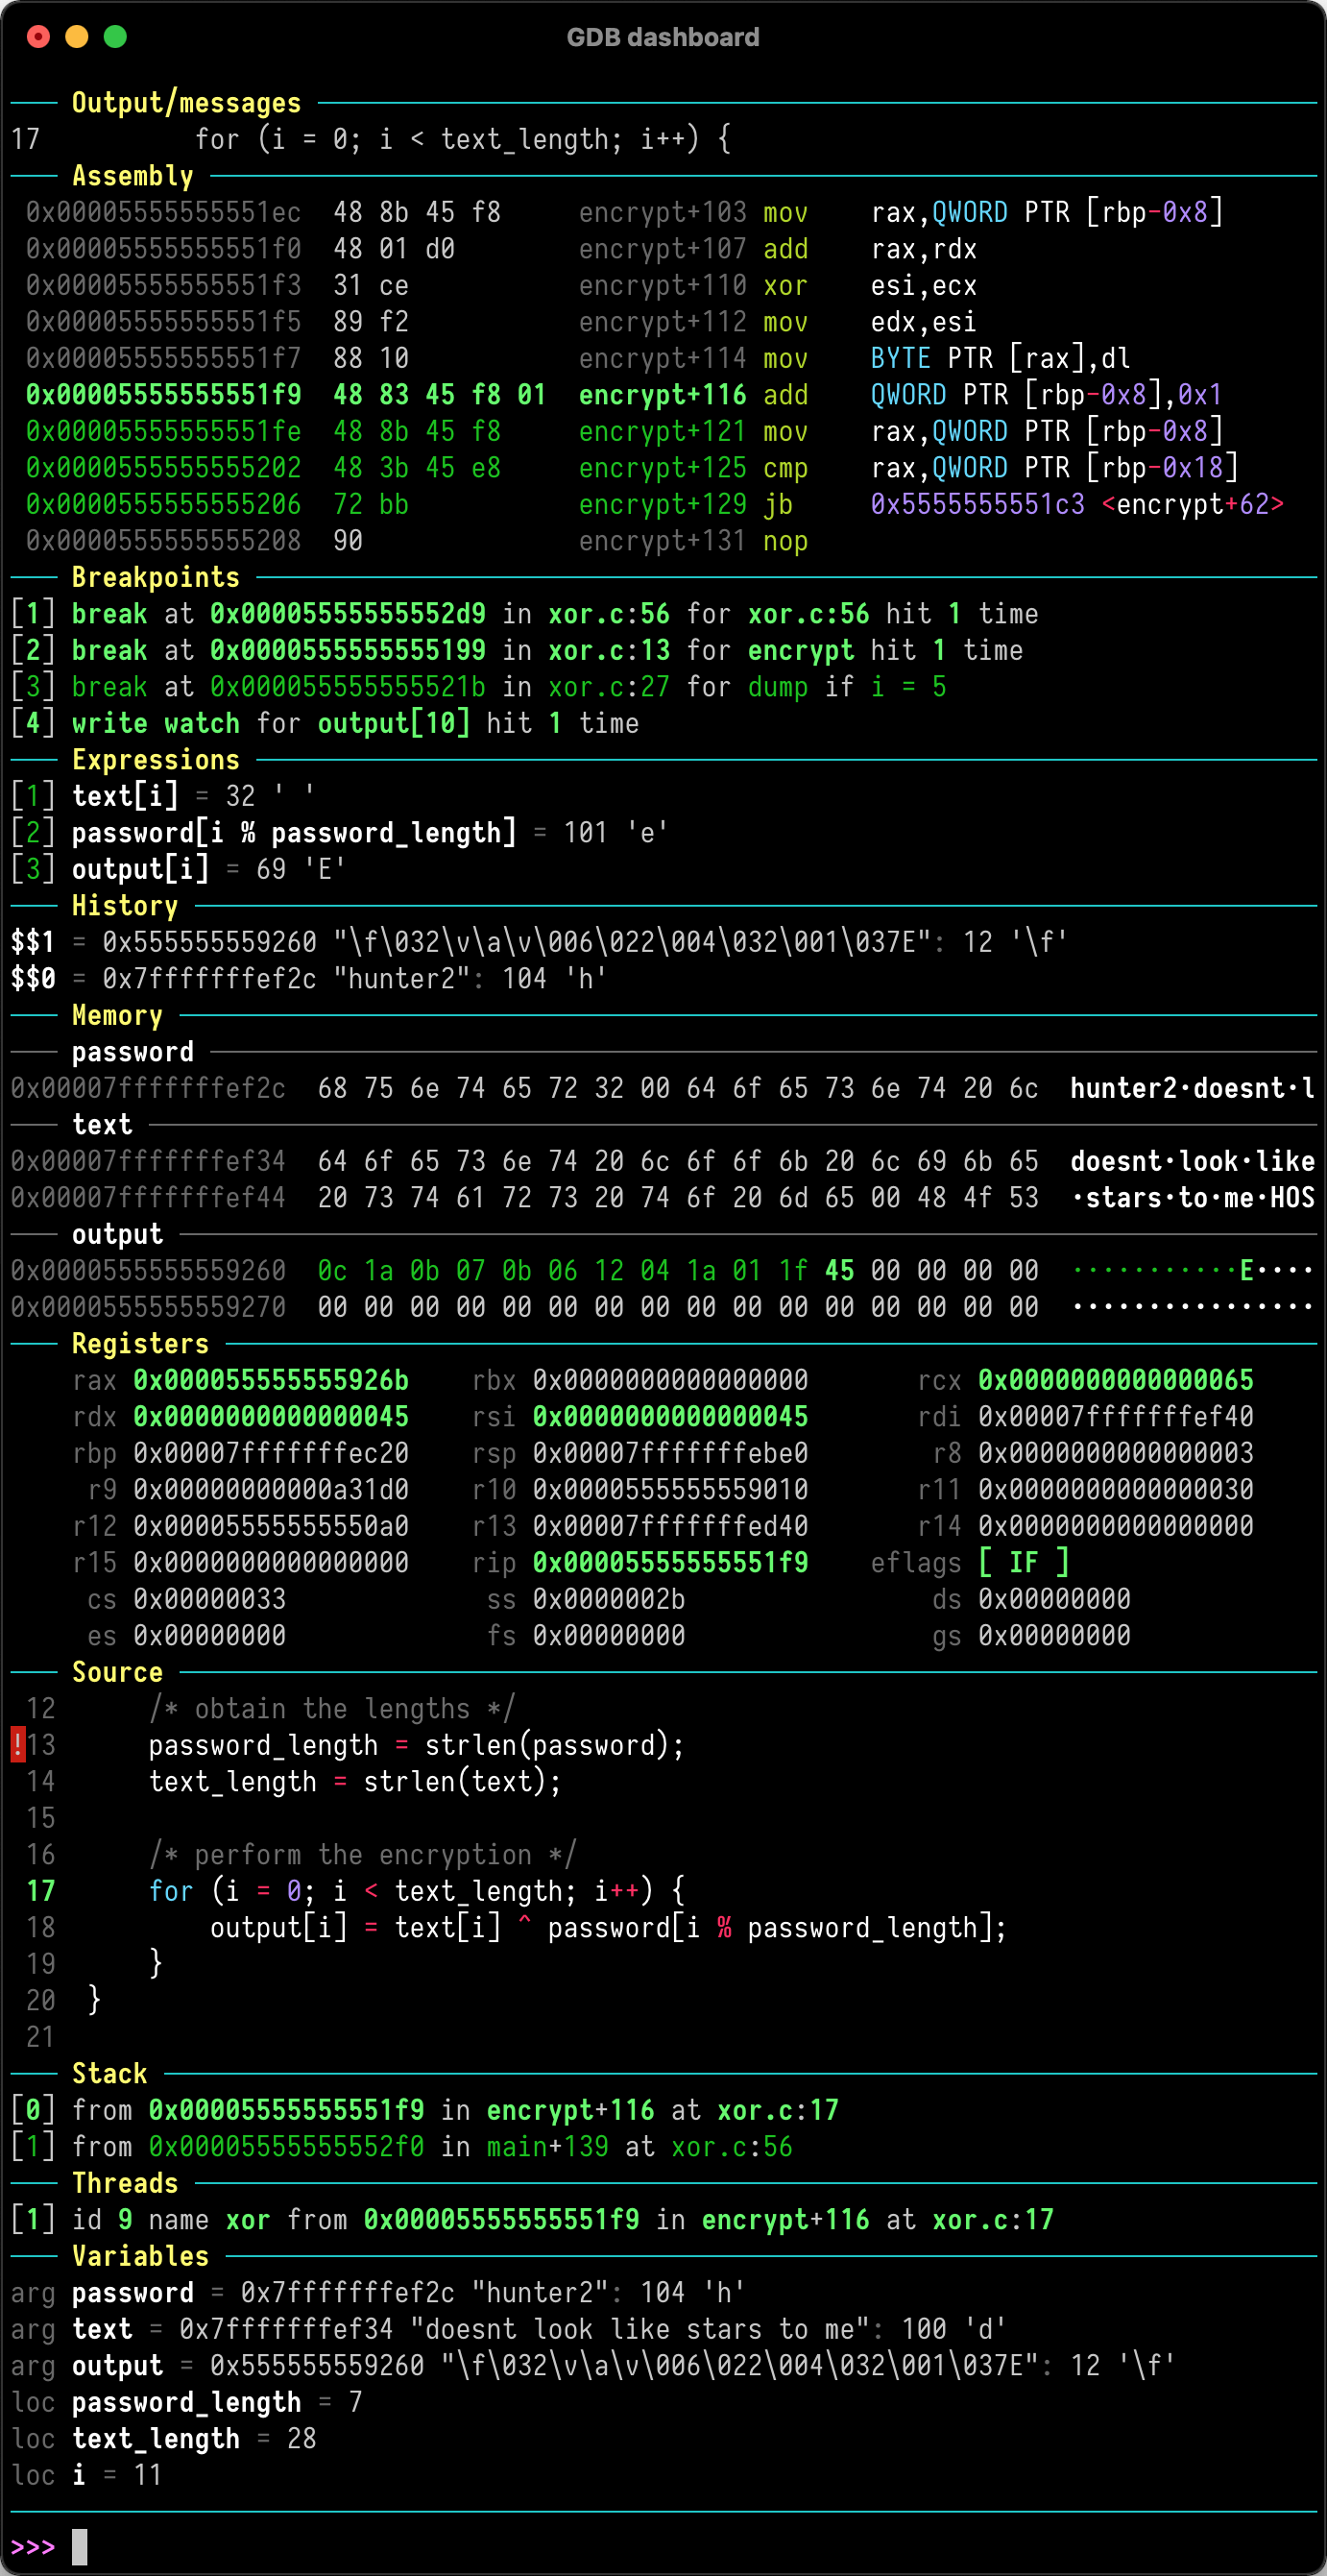
GDB dashboard is a standalone .gdbinit file written using the Python API that enables a modular interface showing relevant information about the program being debugged. Its main goal is to reduce the number of GDB commands needed to inspect the status of current program thus allowing the developer to primarily focus on the control flow.
Quickstart
Just place .gdbinit in your home directory, for example with:
wget -P ~ https://github.com/cyrus-and/gdb-dashboard/raw/master/.gdbinit
Optionally install Pygments to enable syntax highlighting:
pip install pygments
Then debug as usual, the dashboard will appear automatically every time the inferior program stops.
Keep in mind that no GDB command has been redefined, instead all the features are available via the main dashboard command (see help dashboard).
Head to the wiki to learn how to perform the most important tasks.
terminal
microsoft·C++
微软官方的新版 Windows Terminal 终端模拟器,同时包含原版 Windows 控制台宿主,支持多标签、GPU 加速渲染和 WSL,替代老旧的 cmd 窗口。
终端模拟器+4终端模拟器硬核
105365+309.7kv1.25.3131.02026-11-10 18:51 UTC

tabby
Eugeny·TypeScript
一款基于 TypeScript 的现代终端模拟器,支持 SSH、Telnet、串口连接,提供插件扩展和主题定制,适合替代传统终端工具。
终端模拟器+4终端模拟器入门
75372+544.3kv1.0.2382026-11-06 04:03 UTC
alacritty
alacritty·Rust
用 Rust 写的跨平台 GPU 加速终端模拟器,基于 OpenGL 渲染,主打高帧率和低延迟,适合嫌普通终端卡顿、想要更顺滑操作体验的开发者。
终端模拟器+4终端模拟器进阶
66161+373.7kv0.17.02026-11-06 21:34 UTC

termux-app
termux·Java
在 Android 手机上提供完整的 Linux 终端环境,通过安装各类软件包把手机变成便携开发机。
终端模拟器+3终端模拟器进阶
64567+2718.3kv0.118.32026-11-05 09:38 UTC