本地 Docker 启动会自动登录,README 明确说明不适用于生产环境;./rh start 默认从 GHCR 拉取预构建镜像,改本地 Dockerfile 后需用 ./rh restart --build 重建;SDK 连接器依赖进程保持持久出站 WebSocket 连接,进程退出则端点不可用
rhesis
rhesis-ai活跃维护面向 AI Agent 开发团队的协作平台,支持测试、模拟和追踪 Agent 运行,让领域专家标注行为、工程师据此迭代改进。
The collaboration layer for teams building AI agents. Test, simulate, and trace your agents, while domain experts annotate behavior and engineers improve the agent from what they find.
v0.20.1发布于 2026-11-03 17:46 UTC404star40fork同步于 2026-11-10 18:00 UTC
git clone https://github.com/rhesis-ai/rhesis.git && cd rhesis && ./rh start
pip install rhesis-sdk 硬件要求按 README 说明
README 未说明硬件要求;本地方式通过 Docker 运行,前端在 localhost:3000,API 在 localhost:8080/docs
有 Docker 镜像
面向 AI Agent 团队的开源协作层,让领域专家评审反馈直接变成测试和 CI 门禁
面向 AI Agent 开发团队的协作平台,支持测试、模拟和追踪 Agent 运行,让领域专家标注行为、工程师据此迭代改进。
核心能力
- 通过 SDK 或 REST 端点接入被测 Agent,无需公网 URL
- 领域专家在浏览器 playground 中对话并留下通过/失败判定与评论
- 用 Architect 把 PRD 转成需求、指标和测试集并运行
- 用 Penelope 模拟多轮对话,用 Polyphemus 和 garak 做对抗探测
- OpenTelemetry 追踪延迟、token 与成本,自动埋点多个 Agent 框架
容易踩的坑
内容由模型根据 README 生成,可能不完整或不准确,以官方文档为准。看原文 README
- v0.20.1Platform v0.20.1最新正式版2026-11-03 · 2026-11-03 17:46 UTC
Platform Release
This release includes the following component versions:
- Backend 0.20.1
- Frontend 0.20.1
- SDK 0.20.1
Summary of Changes
Backend v0.20.1:
- Fixed endpoint test calls to respect custom configured timeouts instead of falling back to default limits.
- Disabled automatic retries on endpoint read timeouts.
- Resolved security vulnerabilities by updating Python dependencies.
Frontend v0.20.1:
- Added the ability to view, validate, and cancel long-running endpoint tests
- Improved endpoint response mapping with editable test values and direct JSON editing
- Updated npm dependencies to resolve security advisories
SDK v0.20.1:
- Resolved security advisories across npm and Python dependencies
- Added user role and source fields to Grafana dashboards
- Fixed E2E workflow compatibility by pinning CI test runners to Ubuntu 24.04
See individual component changelogs for detailed changes:
- sdk-v0.20.1SDK v0.20.12026-11-03 · 2026-11-03 17:46 UTC
查看更新说明
Security
- Resolved security advisories across Python and npm dependencies (#3106).
Fixed
- Fixed end-to-end testing workflow compatibility by pinning CI runners to
ubuntu-24.04(#3102).
- v0.20.0Platform v0.20.02026-11-02 · 2026-11-02 14:33 UTC
查看更新说明
Platform Release
This release includes the following component versions:
- Backend 0.20.0
- Frontend 0.20.0
- SDK 0.20.0
Summary of Changes
Backend v0.20.0:
- Added S3-compatible blob storage support with strict startup configuration validation.
- Enhanced metric evaluations to pass full trace history and test expectations, enabling targeted span evaluations and tool call trajectory checks.
- Redesigned the Insights registry to add trace latency, token usage, cost, and execution duration analytics alongside new query-shaping parameters.
- Introduced ClickUp MCP tool integration, added a
fromjsonJinja filter for structured inputs, and moved auth email sending to background tasks.
Frontend v0.20.0:
- Introduced interactive charts (line, bar, heat tables) to Architect responses with export options (CSV, SVG, PNG) and layout fixes.
- Redesigned and compacted the trace drawer with timing bars, filterable span trees, and a new Traces tab in test results.
- Enhanced the Endpoint Wizard to allow editing test payloads as JSON and creating endpoints without blocking on failed tests.
- Refreshed sidebar navigation with scroll cues, improved dark mode styling, and updated Insights grouping.
SDK v0.20.0:
- Refactored metric signatures to accept unified
traceandexpectationsparameters (breaking change), allowing metrics to evaluate full trace spans or build traces in-memory. - Introduced metric targets for evaluating specific parts of a trace and added the
ToolCallTrajectorymetric to compare agent execution against expected tool calls. - Enhanced Architect agent capabilities with interactive charting tools (
ShowChartTool), improved tool failure/retry handling, and expanded Insights query shaping (time_grain,order_by,limit). - Added ClickUp MCP integration, parameter-name recording on tool spans, and improved cache token calculations for streamed LangChain calls.
See individual component changelogs for detailed changes:
- sdk-v0.20.0SDK v0.20.02026-11-02 · 2026-11-02 14:33 UTC
查看更新说明
Added
- Tool Call Trajectory Metric: Introduced
ToolCallTrajectoryto evaluate agent tool call sequences against expected tool calls defined in test configurations (Test(expected_tool_calls=[...])). - Metric Targets: Added metric targeting support, enabling metrics to evaluate specific sub-paths or target scopes within a trace.
- In-Memory Trace Construction: Added
Trace.from_response()andTrace.from_conversation()to allow trace and metric evaluations without requiring active background telemetry tracing. - Trace Access for Custom Metrics: Code metrics (
@metric) can now declare atraceparameter to inspect detailed trace spans, kinds, inputs, outputs, tool calls, and metadata. - Agent Charting Capabilities: Added
ShowChartToolallowing agents to construct charts from insights queries with custom focus filters and chart types. - Enhanced Insights Query Shaping: Added
time_grain,order_by,limit, andmin_countparameters toInsightsqueries, alongside anInsights.describe()method for registry schema introspection. - Named Tool Parameters in Telemetry: Tool spans now capture positional and keyword parameters by parameter name under
ai.tool.arguments.
Changed
- Metric Evaluation Signature (BREAKING CHANGE): Standardized
evaluate()anda_evaluate()signatures across all metrics to accept(input, output, trace, expectations).- Individual evaluation parameters (
expected_output,context,tool_calls,metadata,conversation_history,goal,instructions,contract) have been removed in favor ofexpectationsandtrace/conversation. @metricfunctions using legacy parameter names must update their signatures to usetraceandexpectations.
- Individual evaluation parameters (
- Retrieval Telemetry Format: Telemetry hooks for LangChain, Haystack, and
@observe.retrievalnow record full document lists as JSON objects rather than truncated preview strings. - Architect Approval & Retry Logic: Tightened agent execution by preventing infinite retry loops on failing tool calls, validating placeholder IDs before dispatch, and strictly scoping user approvals (
Accept) to specific targeted calls.
Fixed
- LangChain Streamed Cache Token Calculations: Corrected input token pricing on streamed LangChain calls by subtracting
cache_readandcache_creationdetails from the total input token count. - Tool Routing in Multi-Provider Agents: Fixed an issue in
BaseAgentwhere named tool execution failed when routed across multiple tool providers. - Score & Choice Validation: Added strict validation checks for numeric judge scores and categorical decision model outputs.
- Architect Chart Rendering: Resolved issues with grouped bar focus matching, area/stacked bar constraints on non-count metrics, and chart title formatting.
- Tool Call Trajectory Metric: Introduced
- v0.19.1Platform v0.19.12026-10-23 · 2026-10-23 08:32 UTC
查看更新说明
Platform Release
This release includes the following component versions:
- Backend 0.19.1
- Frontend 0.19.1
- SDK 0.19.1
Summary of Changes
Backend v0.19.1:
- Added
created_atandupdated_attimestamp fields to API task responses. - Fixed an issue where SDK multi-turn conversation runs split turns into separate traces.
- Updated backend dependencies (
certifi,nltk,uv,pillow) to resolve security advisories.
Frontend v0.19.1:
- Redesigned endpoint creation into a four-step guided wizard with step navigation, connection testing, and raw JSON response previews.
- Added turn navigation to conversation traces, enabling users to step through multi-turn conversations and open specific turns from replies.
- Restored the dark mode toggle to the user menu with support for automatically matching browser theme preferences.
- Enhanced UI components by adding empty states for unmatched metric filters and moving tags to the bottom of the metric detail page.
SDK v0.19.1:
- Updated dependencies including
nltk,certifi,uv, andpillowto address security vulnerabilities. - Fixed an issue where authentication fields were not preserved when caching settings.
- Improved theme handling to automatically follow browser dark mode preferences.
- Resolved an issue to ensure the trace metrics grid automatically refreshes on change.
See individual component changelogs for detailed changes:
用户点评
登录用户的真实使用记录,可按版本和硬件筛选共 0 条
还没有人点评。第一个说出真实体验的人最有价值。
Why Rhesis?
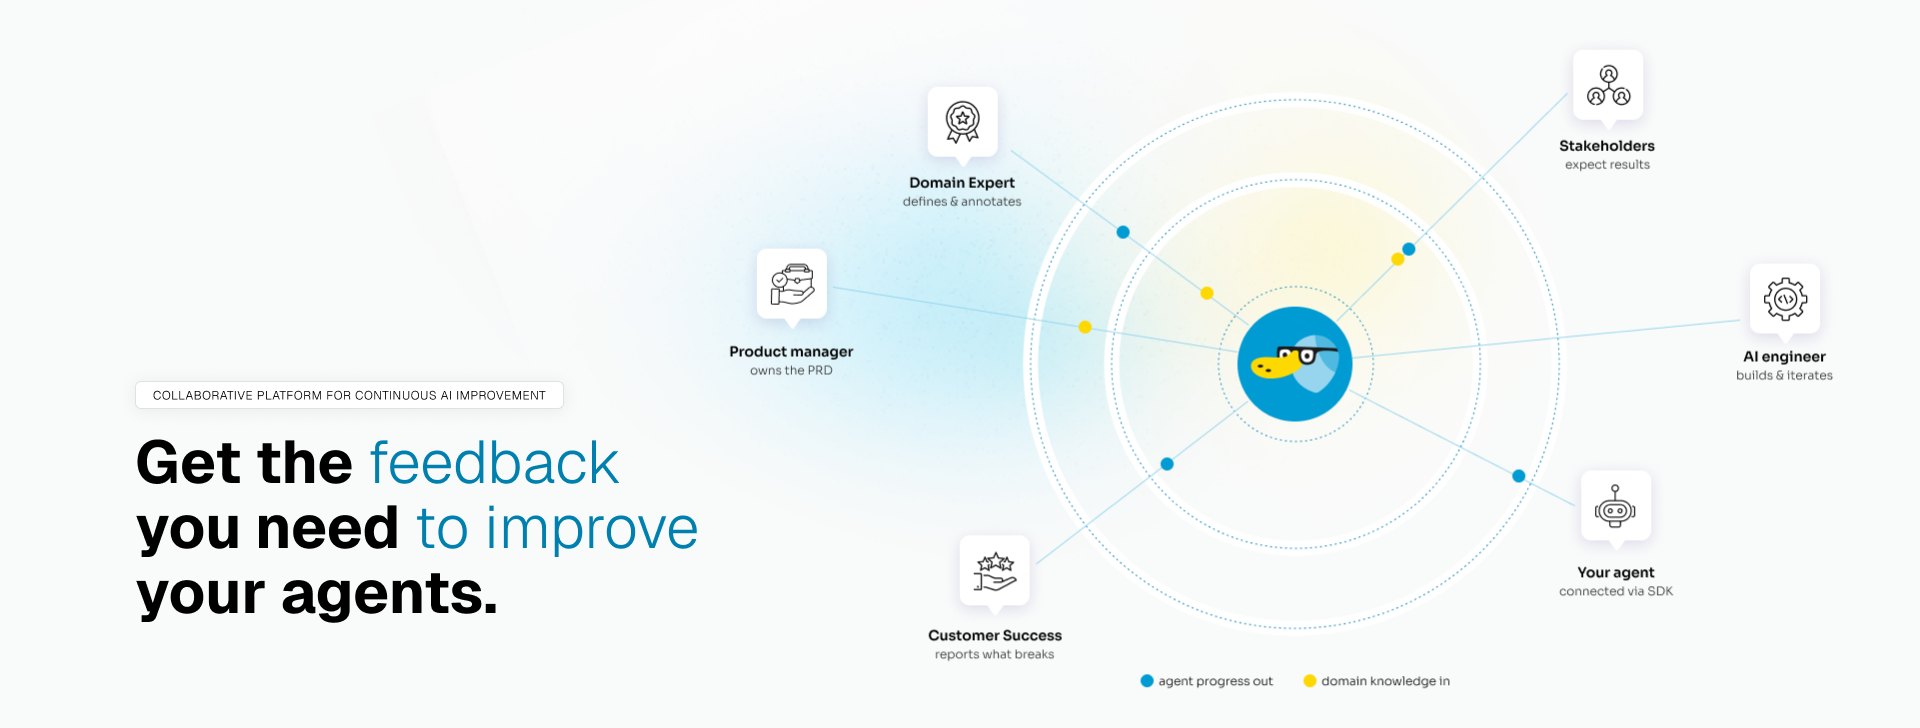
Most tools start with tests or traces. Rhesis starts one step earlier: the people who know what the agent should answer are not the people building it, and their feedback rarely arrives in a form you can act on.
- Feedback that stays attached. Every review sits on the test case and the agent version that produced it, not in a Slack thread
- One pass/fail bar. The whole team reviews against the same tests, and you measure against them
- UI for reviewers, SDK and MCP for builders. Same data, three ways in
- From feedback to CI. Recurring feedback becomes tests and metrics that run on every change
How it works
1. Connect the agent you are building. Via the SDK or a REST endpoint, no public URL needed (how, video).
2. Share the Rhesis link with your stakeholders. Domain experts, product managers, and reviewers open it in a browser. Nothing to install, no code.
3. They put the agent to work. In the playground they chat with the live agent and turn interesting conversations into tests. They create and run test sets, simulate multi-turn conversations, and leave structured feedback on what came back: pass/fail verdicts and comments, down to the individual metric or conversation turn.
4. Pull that feedback back into development. Read it from the SDK or the REST API, or work with it from Cursor, Claude Code, and other MCP clients through the Rhesis skill. Fix the agent, run the same tests again.
5. Agree on what the agent has to get right. Each cycle, feedback that arrived as prose becomes tests and metrics that check the same thing automatically. Reviews on a handful of cases end up as evals that run on every change.
Who it’s for
| Role | How they use Rhesis |
|---|---|
| AI engineers | Connect the agent, pull feedback and reviewed test sets into the SDK, CI, and MCP while you build |
| Domain experts | Try the agent, review its answers, say what is wrong and what a correct answer looks like. UI, no code |
| Product managers | Turn scattered feedback into tests, and see whether the agent improves against the PRD. UI or MCP |
Capabilities
Nobody can review every case by hand. Once the first feedback is in, you can grow coverage from it:
- Architect: a chat agent that turns a PRD into requirements, metrics, and test sets, runs them, and charts the results
- Test generation from your requirements, a PRD, or an uploaded file
- Conversation simulation with Penelope; adversarial probing with Polyphemus and garak
- Requirement coverage: see which requirements pass or fail, and in which conversations
- Production tracing: OpenTelemetry traces with latency, tokens, and cost. Auto-instrumentation for LangChain, LangGraph, Microsoft Agent Framework, Pydantic AI, Google ADK, and Haystack
- Experiments: compare model, prompt, or retrieval changes on the same test set, by quality and cost
Generated tests are only as good as the requirements behind them. Instead of retyping a spec into a prompt, connect the tools your requirements already live in (Notion, GitHub, Jira, Confluence) and Rhesis writes tests from the real thing. See Tools.
From what your experts know to what runs in CI
| Who knows it | What they know | What Rhesis checks |
|---|---|---|
| Legal | "Bookings more than 24 h before departure are fully refundable." | The agent quotes the right refund terms for this booking's dates, across multi-turn conversations |
| Support lead | "Business accounts always escalate to a named contact." | Escalation is offered on the business tier, never on the consumer tier, and the contact is named |
| Product | "If the customer changes topic, the agent still finishes the cancellation." | Simulated users interrupt and rephrase; the agent keeps the booking reference and completes the task |
| Marketing | "We never promise delivery dates." | Adversarial prompts try to get a promise out of it; the brand-voice metric flags any that work |
None of these come from a metric library. Your team writes them once as requirements, and they run on every change.
Details: docs.rhesis.ai
Get started
Cloud
app.rhesis.ai: managed service, connect your agent and invite your team.
Local (Docker)
git clone https://github.com/rhesis-ai/rhesis.git && cd rhesis && ./rh start
./rh start pulls prebuilt images from GHCR. To build from the repo instead, use ./rh start --build (and ./rh restart --build after local Dockerfile changes).
Access: Frontend at localhost:3000, API at localhost:8080/docs
Commands: ./rh logs · ./rh stop · ./rh restart · ./rh delete
Local setup auto-logs you in. Not for production; see below.
Once the platform is running, connect your agent with the SDK:
pip install rhesis-sdk
See sdk/README.md.
Deployment options
| Option | Best for |
|---|---|
| Rhesis Cloud | Managed by us, nothing to run |
Local Docker (./rh start) | Development and trying the platform |
| Docker Compose | A single server |
| Kubernetes (Helm) | Production clusters, via ArgoCD and the charts/rhesis chart we run ourselves |
| GCP (Terraform) | Provisioning a GKE cluster from scratch |
More: self-hosting docs.
Connect your agent
Rhesis needs a way to invoke the agent under test. Two ways to do it: we recommend the SDK connector, but if your agent already has a public REST endpoint, that is the fastest way to get started.
SDK connector (recommended)
Your process opens a persistent outbound WebSocket. Rhesis sends test inputs down that connection, so the agent needs no public URL and can stay on your laptop or inside your VPC. You write a function instead of describing a payload, and the same SDK carries tracing.
from rhesis.sdk.decorators import endpoint

@endpoint(name="my-chatbot")
def chat(message: str) -> str:
    # Call your agent here
    return my_agent(message)
Run it, and the endpoint registers itself in Rhesis. See the SDK README for install, environments, and tracing.
Your agent's REST endpoint (fastest start if it is public)
Already serving HTTP on a reachable URL? Register it in the UI, no code and nothing to deploy. You supply auth headers plus request and response mapping, or let Rhesis derive the configuration from an OpenAPI spec or by exploring the endpoint. See Creating endpoints.
Either way, the next step is the same: share the link, and let your team start using the agent through the playground and test runs.
Work from your own tools
Feedback lands in Rhesis, but you do not have to leave your editor to act on it.
MCP and skills
Use Rhesis from MCP-capable clients (Cursor, Claude Code, and others): build test sets, pull results, trigger runs, and read the feedback in the tools you already work in. Install with the skills CLI:
npx skills add rhesis-ai/rhesis
See the skills README.
SDK and REST API
Pull test runs, results, and the reviews attached to them from Python, or hit the API directly from CI in any language: OpenAPI spec.
The SDK also handles tracing. LLMs for generation and judges: Models.
In this repo
| Path | What it covers |
|---|---|
sdk/ | Python SDK: connector, synthesizers, metrics, tracing |
skills/rhesis/ | Agent skill + MCP workflows for Cursor, Claude Code, and others |
apps/backend/ | API and workers |
apps/frontend/ | Web UI |
docs/ | Documentation site source |
charts/rhesis/ | Helm chart for Kubernetes deployments |
terraform/ | Infrastructure as code for GCP |
Open source
MIT licensed. No plans to relicense core features. Enterprise features live in ee/ and remain separate.
We built Rhesis because the feedback that mattered most kept getting stuck outside the development loop. If you face the same problem, contributions are welcome.
Contributing
See CONTRIBUTING.md for guidelines.
Ways to contribute: Fix bugs or add features · Contribute test sets for common failure modes · Improve documentation · Help others in Discord or GitHub discussions
Support
- Documentation: Guides and API reference
- Discord: Community support
- GitHub Issues: Bug reports and feature requests
Security & privacy
We take data security seriously. See our Privacy Policy for details.
Telemetry: Rhesis collects basic, anonymized usage statistics to improve the product. No sensitive data is collected or shared with third parties.
- Self-hosted: Opt out by setting
OTEL_RHESIS_TELEMETRY_ENABLED=false - Cloud: Telemetry enabled as part of Terms & Conditions