仪表盘不向后兼容旧版 Grafana,需较新版本才能正常显示;用 ArgoCD、ConfigMap 或 Terraform 方式部署时须额外启用 Grafana dashboards sidecar;k8s-views-nodes 面板在节点 IP 变更或 nodename 标签异常时会失效
grafana-dashboards-kubernetes
dotdcApache-2.0活跃维护一套开箱即用的现代化 Grafana 看板,专门用来监控 Kubernetes 集群,配合 Prometheus 和 kube-state-metrics 直接导入就能看到节点、Pod 和资源状态。
A set of modern Grafana dashboards for Kubernetes.
v3.0.8发布于 2026-09-20 21:04 UTC3,832star +1 / 7 天489fork同步于 2026-11-10 23:40 UTC
git clone https://github.com/dotdc/grafana-dashboards-kubernetes.git
cd grafana-dashboards-kubernetes 硬件要求按 README 说明
README 未说明硬件要求;需在 Kubernetes 集群中已部署 kube-state-metrics 与 prometheus-node-exporter,Grafana 版本需支持 gradient mode(8.1+)等新特性
一套面向 Kubernetes 的现代 Grafana 仪表盘集合,开箱即用覆盖全局、节点、Pod 等视图
一套开箱即用的现代化 Grafana 看板,专门用来监控 Kubernetes 集群,配合 Prometheus 和 kube-state-metrics 直接导入就能看到节点、Pod 和资源状态。
核心能力
- 提供 Global、Namespaces、Nodes、Pods 四个层级的视图仪表盘
- 附带 API Server、CoreDNS、Prometheus、Trivy Operator 等组件面板
- 基于 kube-state-metrics 与 node-exporter 指标构建
- 使用 Grafana 7.2+ 的 $__rate_interval 与 7.4+ 时间序列面板
- 内置 Prometheus 数据源变量,适配联邦 Grafana 实例
容易踩的坑
内容由模型根据 README 生成,可能不完整或不准确,以官方文档为准。看原文 README
- v3.0.8最新正式版2026-09-20 · 2026-09-20 21:04 UTC
- v3.0.72026-09-20 · 2026-09-20 20:55 UTC
- v3.0.62026-03-24 · 2026-03-24 21:44 UTC
- v3.0.52026-03-24 · 2026-03-24 20:05 UTC
- v3.0.42026-03-24 · 2026-03-24 12:54 UTC
用户点评
登录用户的真实使用记录,可按版本和硬件筛选共 0 条
还没有人点评。第一个说出真实体验的人最有价值。
grafana-dashboards-kubernetes
Table of contents
Description
This repository contains a modern set of Grafana dashboards for Kubernetes.
They are inspired by many other dashboards from kubernetes-mixin and grafana.com.
More information about them in my article: A set of modern Grafana dashboards for Kubernetes
You can also download them on Grafana.com.
Releases
This repository follows semantic versioning for releases.
It relies on conventional commits to automate releases using semantic-release.
Features
These dashboards are made and tested for the kube-prometheus-stack chart, but they should work well with others as soon as you have kube-state-metrics and prometheus-node-exporter installed on your Kubernetes cluster.
They are not backward compatible with older Grafana versions because they try to take advantage of Grafana's newest features like:
gradient modeintroduced in Grafana 8.1 (Grafana Blog post)time seriesvisualization panel introduced in Grafana 7.4 (Grafana Blog post)$__rate_intervalvariable introduced in Grafana 7.2 (Grafana Blog post)
They also have a Prometheus Datasource variable so they will work on a federated Grafana instance.
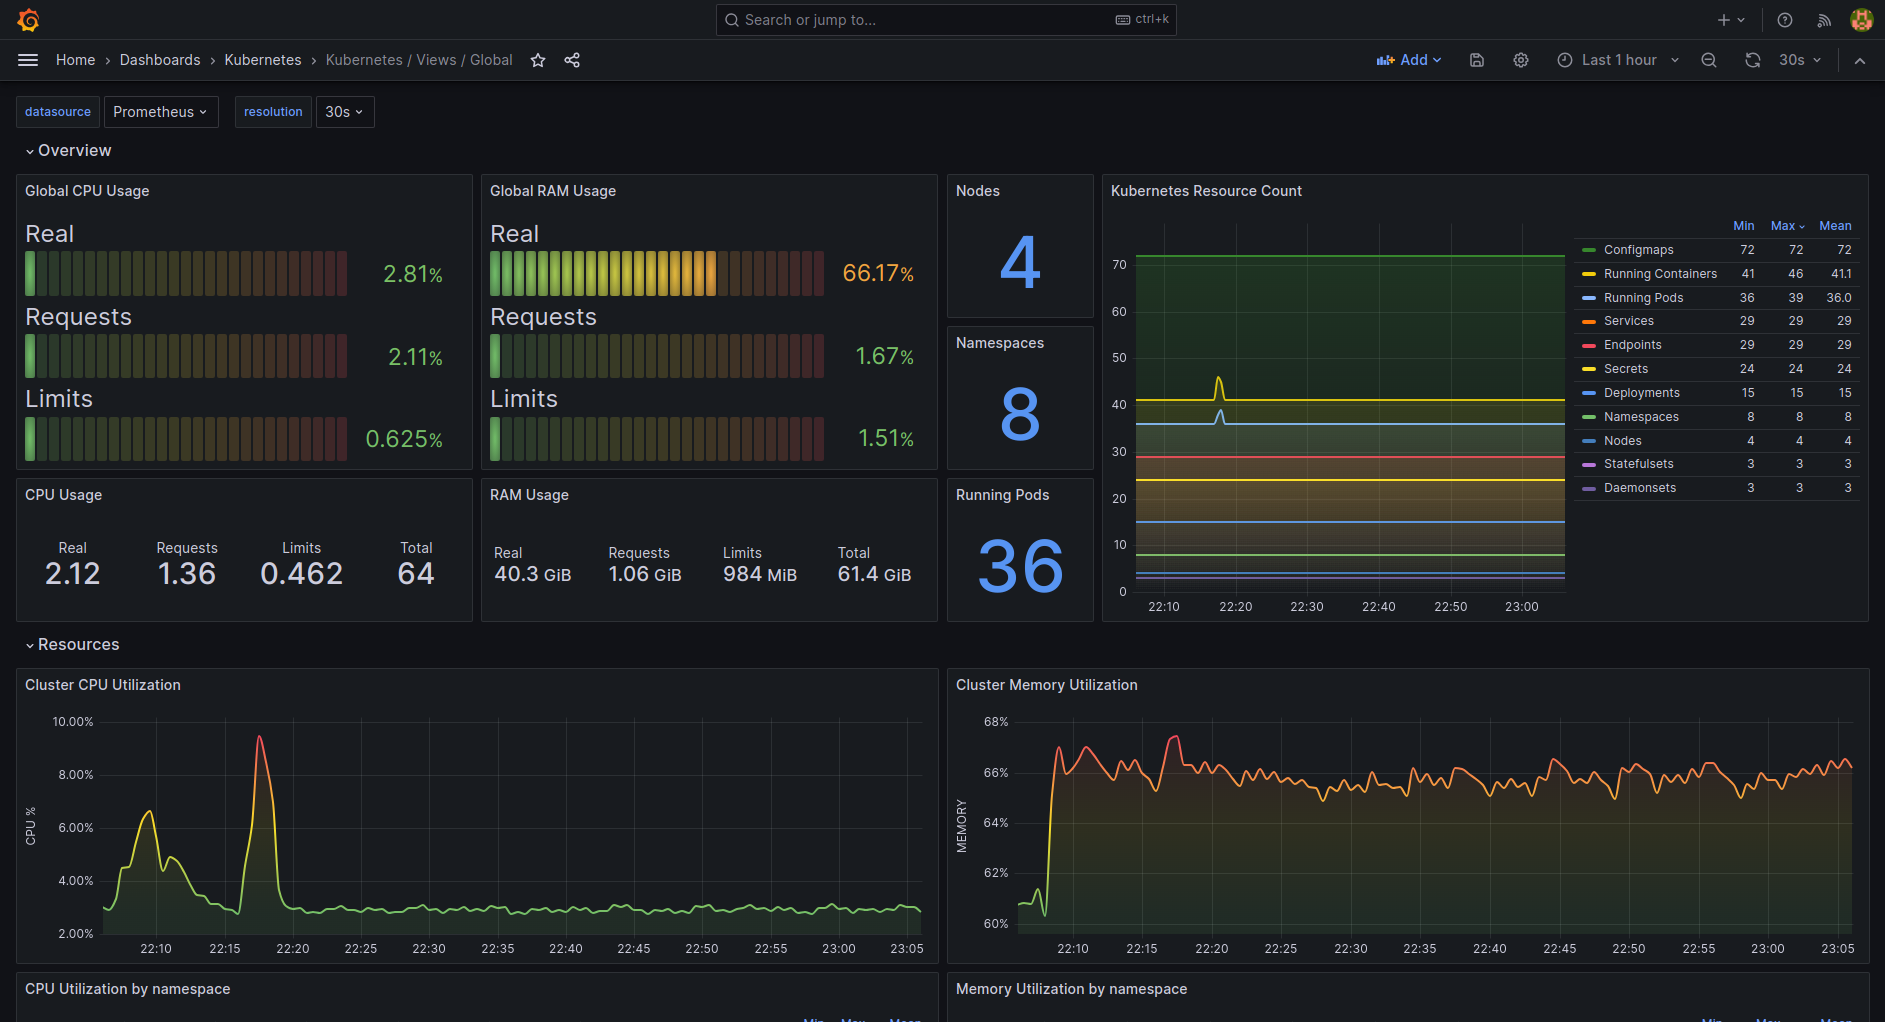
As an example, here's how the Kubernetes / Views / Global dashboard looks like:
Dashboards
| File name | Description | Screenshot |
|---|---|---|
| k8s-addons-prometheus.json | Dashboard for Prometheus. | Screenshot |
| k8s-addons-trivy-operator.json | Dashboard for the Trivy Operator from Aqua Security. | Screenshot |
| k8s-system-api-server.json | Dashboard for the API Server Kubernetes component. | Screenshot |
| k8s-system-coredns.json | Dashboard for the CoreDNS Kubernetes component. | Screenshot |
| k8s-views-global.json | Global level view dashboard for Kubernetes. | Screenshot |
| k8s-views-namespaces.json | Namespaces level view dashboard for Kubernetes. | Screenshot |
| k8s-views-nodes.json | Nodes level view dashboard for Kubernetes. | Screenshot |
| k8s-views-pods.json | Pods level view dashboard for Kubernetes. | Screenshot |
Installation
In most cases, you will need to clone this repository (or your fork):
git clone https://github.com/dotdc/grafana-dashboards-kubernetes.git
cd grafana-dashboards-kubernetes
If you plan to deploy these dashboards using ArgoCD, ConfigMaps or Terraform, you will also need to enable and configure the dashboards sidecar on the Grafana Helm chart to get the dashboards loaded in your Grafana instance:
# kube-prometheus-stack values
grafana:
  sidecar:
    dashboards:
      enabled: true
      defaultFolderName: "General"
      label: grafana_dashboard
      labelValue: "1"
      folderAnnotation: grafana_folder
      searchNamespace: ALL
      provider:
        foldersFromFilesStructure: true
Install manually
In your Grafana instance, put your mouse over the + sign on the left menu, then click on Import.
Once you are on the Import page, you can upload the JSON files one by one from your local copy using the Upload JSON file button.
Install via grafana.com
In your Grafana instance, put your mouse over the + sign on the left menu, then click on Import.
Once you are on the Import page, you can put the grafana.com dashboard ID (see table below) under Import via grafana.com then click on the Load button. Repeat for each dashboard.
Grafana.com dashboard id list:
| Dashboard | ID |
|---|---|
| k8s-addons-prometheus.json | 19105 |
| k8s-addons-trivy-operator.json | 16337 |
| k8s-system-api-server.json | 15761 |
| k8s-system-coredns.json | 15762 |
| k8s-views-global.json | 15757 |
| k8s-views-namespaces.json | 15758 |
| k8s-views-nodes.json | 15759 |
| k8s-views-pods.json | 15760 |
Install with ArgoCD
If you are using ArgoCD, this will deploy the dashboards in the default project of ArgoCD:
kubectl apply -f argocd-app.yml
You will also need to enable and configure the Grafana dashboards sidecar as described in Installation.
Install with Helm values
If you use the official Grafana helm chart or kube-prometheus-stack, you can install the dashboards directly using the dashboardProviders & dashboards helm chart values.
Depending on your setup, add or merge the following block example to your helm chart values.
The example is for kube-prometheus-stack, for the official Grafana helm chart, remove the first line (grafana:), and reduce the indentation level of the entire block.
grafana:
  # Provision grafana-dashboards-kubernetes
  dashboardProviders:
    dashboardproviders.yaml:
      apiVersion: 1
      providers:
      - name: 'grafana-dashboards-kubernetes'
        orgId: 1
        folder: 'Kubernetes'
        type: file
        disableDeletion: true
        editable: true
        options:
          path: /var/lib/grafana/dashboards/grafana-dashboards-kubernetes
  dashboards:
    grafana-dashboards-kubernetes:
      k8s-system-api-server:
        url: https://raw.githubusercontent.com/dotdc/grafana-dashboards-kubernetes/master/dashboards/k8s-system-api-server.json
        token: ''
      k8s-system-coredns:
        url: https://raw.githubusercontent.com/dotdc/grafana-dashboards-kubernetes/master/dashboards/k8s-system-coredns.json
        token: ''
      k8s-views-global:
        url: https://raw.githubusercontent.com/dotdc/grafana-dashboards-kubernetes/master/dashboards/k8s-views-global.json
        token: ''
      k8s-views-namespaces:
        url: https://raw.githubusercontent.com/dotdc/grafana-dashboards-kubernetes/master/dashboards/k8s-views-namespaces.json
        token: ''
      k8s-views-nodes:
        url: https://raw.githubusercontent.com/dotdc/grafana-dashboards-kubernetes/master/dashboards/k8s-views-nodes.json
        token: ''
      k8s-views-pods:
        url: https://raw.githubusercontent.com/dotdc/grafana-dashboards-kubernetes/master/dashboards/k8s-views-pods.json
        token: ''
Install as ConfigMaps
Grafana dashboards can be provisioned as Kubernetes ConfigMaps if you configure the dashboard sidecar available on the official Grafana Helm Chart.
To build the ConfigMaps and output them on STDOUT :
kubectl kustomize .
Note: no namespace is set by default, you can change that in the kustomization.yaml file.
To build and deploy them directly on your Kubernetes cluster :
kubectl apply -k . -n monitoring
You will also need to enable and configure the Grafana dashboards sidecar as described in Installation.
Note: you can change the namespace if needed.
Install as ConfigMaps with Terraform
If you use Terraform to provision your Kubernetes resources, you can convert the generated ConfigMaps to Terraform code using tfk8s.
To build and convert ConfigMaps to Terraform code :
kubectl kustomize . | tfk8s
You will also need to enable and configure the Grafana dashboards sidecar as described in Installation.
Note: no namespace is set by default, you can change that in the kustomization.yaml file.
Install as GrafanaDashboard with Grafana Operator
If you use Grafana Operator to provision your Grafana dashboards, you can use the following manifests:
Make sure to use your proper namespace.
apiVersion: grafana.integreatly.org/v1beta1
kind: GrafanaDashboard
metadata:
  name: k8s-system-api-server
  namespace: monitoring
spec:
  instanceSelector:
    matchLabels:
      dashboards: "grafana"
  url: "https://raw.githubusercontent.com/dotdc/grafana-dashboards-kubernetes/master/dashboards/k8s-system-api-server.json"
---
apiVersion: grafana.integreatly.org/v1beta1
kind: GrafanaDashboard
metadata:
  name: k8s-system-coredns
  namespace: monitoring
spec:
  instanceSelector:
    matchLabels:
      dashboards: "grafana"
  url: "https://raw.githubusercontent.com/dotdc/grafana-dashboards-kubernetes/master/dashboards/k8s-system-coredns.json"
---
apiVersion: grafana.integreatly.org/v1beta1
kind: GrafanaDashboard
metadata:
  name: k8s-views-global
  namespace: monitoring
spec:
  instanceSelector:
    matchLabels:
      dashboards: "grafana"
  url: "https://raw.githubusercontent.com/dotdc/grafana-dashboards-kubernetes/master/dashboards/k8s-views-global.json"
---
apiVersion: grafana.integreatly.org/v1beta1
kind: GrafanaDashboard
metadata:
  name: k8s-views-namespaces
  namespace: monitoring
spec:
  instanceSelector:
    matchLabels:
      dashboards: "grafana"
  url: "https://raw.githubusercontent.com/dotdc/grafana-dashboards-kubernetes/master/dashboards/k8s-views-namespaces.json"
---
apiVersion: grafana.integreatly.org/v1beta1
kind: GrafanaDashboard
metadata:
  name: k8s-views-nodes
  namespace: monitoring
spec:
  instanceSelector:
    matchLabels:
      dashboards: "grafana"
  url: "https://raw.githubusercontent.com/dotdc/grafana-dashboards-kubernetes/master/dashboards/k8s-views-nodes.json"
---
apiVersion: grafana.integreatly.org/v1beta1
kind: GrafanaDashboard
metadata:
  name: k8s-views-pods
  namespace: monitoring
spec:
  instanceSelector:
    matchLabels:
      dashboards: "grafana"
  url: "https://raw.githubusercontent.com/dotdc/grafana-dashboards-kubernetes/master/dashboards/k8s-views-pods.json"
Known issue(s)
Broken panels due to a too-high resolution
A user reported in #50 that some panels were broken because the default value of the $resolution variable was too low. The root cause hasn't been identified precisely, but he was using Grafana Agent & Grafana Mimir. Changing the $resolution variable to a higher value (a lower resolution) will likely solve the issue.
To make the fix permanent, you can configure the Scrape interval in your Grafana Datasource to a working value for your setup.
Broken panels on k8s-views-nodes when a node changes its IP address
To make this dashboard more convenient, there's a small variable hack to display node instead of instance.
Because of that, some panels could lack data when a node changes its IP address as reported in #102.
There is currently no known fix for this scenario, though it should be a corner case for most deployments. Contributions with ideas or solutions are welcome.
Broken panels on k8s-views-nodes due to the nodename label
The k8s-views-nodes dashboard will have many broken panels if the node label from kube_node_info doesn't match the nodename label from node_uname_info.
This situation can happen on certain deployments of the node exporter running inside Kubernetes(e.g. via a DaemonSet), where nodename takes a different value than the node name as understood by the Kubernetes API.
Below are some ways to relabel the metric to force the nodename label to the appropriate value, depending on the way the collection agent is deployed:
Directly through the Prometheus configuration file
Assuming the node exporter job is defined through kubernetes_sd_config, you can take advantage of the internal discovery labels and fix this by adding the following relabeling rule to the job:
# File: prometheus.yaml
scrape_configs:
- job_name: node-exporter
  relabel_configs:
  # Add this
  - action: replace
    source_labels: [ __meta_kubernetes_pod_node_name]
    target_label: nodename
Through a ServiceMonitor
If using the Prometheus operator or the Grafana agent in operator mode, the scrape job should instead be configured via a ServiceMonitor that will dynamically edit the Prometheus configuration file. In that case, the relabeling has a slightly different syntax:
# File: service-monitor.yaml
apiVersion: monitoring.coreos.com/v1
kind: ServiceMonitor
metadata:
  name: node-exporter
spec:
  endpoints:
  - port: http-metrics
    relabelings:
    # Add this
    - action: replace
      sourceLabels: [__meta_kubernetes_node_name]
      targetLabel: nodename
As a convenience, if using the kube-prometheus-stack helm chart, this added rule can be directly specified in your values.yaml:
# File: kube-prometheus-stack-values.yaml
prometheus-node-exporter:
  prometheus:
    monitor:
      relabelings:
      - action: replace
        sourceLabels: [__meta_kubernetes_pod_node_name]
        targetLabel: nodename
With Grafana Alloy
Grafana Alloy can bundle its own node_exporter. In that case, relabeling can be done this way:
prometheus.exporter.unix "node_exporter" {
}

prometheus.scrape "node_exporter" {
  targets    = prometheus.exporter.unix.node_exporter.targets
  forward_to = [prometheus.relabel.node_exporter.receiver]
  job_name   = "node-exporter"
}

prometheus.relabel "node_exporter" {
  forward_to = [prometheus.remote_write.<your_component>.receiver]

  rule {
    action       = "replace"
    replacement  = sys.env("HOSTNAME")
    target_label = "nodename"
  }
}
If you deploy Alloy with the Helm chart, the HOSTNAME environment variable is set to the Kubernetes node name by default. If you use a custom deployment, adjust the value used for nodename to match your node naming scheme.
Windows support
The dashboards currently don't support Windows. We experimented with Windows support in the k8s-views-global dashboard, but it ended up breaking some panels, so it has been removed for now. You can download the last Windows-compatible version of the dashboard or download revision 43 on Grafana.com.
See #79
Contributing
Feel free to contribute to this project:
- Give a GitHub ⭐ if you like it
- Create an Issue to make a feature request, report a bug or share an idea.
- Create a Pull Request if you want to share code or anything useful to this project.

kubernetes
kubernetes·Go
生产级的容器编排与调度平台,用来自动化部署、扩缩容和管理跨主机的容器化应用。
容器编排+4容器 / Kubernetes硬核
128986+10645kv1.37.22026-11-10 22:35 UTC

uptime-kuma
louislam·JavaScript
自托管的网站与服务可用性监控面板,支持 HTTP、TCP、Ping 等多种探活方式,通过实时图表和告警通知掌握服务宕机情况。
可用性监控+4容器 / Kubernetes入门
93467+1328.7k2.5.92026-11-10 04:49 UTC
mall
macrozheng·Java
基于 Spring Boot + MyBatis 的完整电商系统,含前台商城和后台管理,覆盖商品、订单、会员、促销等模块,用 Docker 容器化部署。
电商系统+4容器 / Kubernetes进阶
85031+1930kv1.0.32026-09-15 02:34 UTC

moby
moby·Go
构建容器化系统的开源协作项目,提供可拼装的组件,用来搭建和定制自己的容器平台,也是 Docker 的上游基础。
容器引擎+3容器 / Kubernetes硬核
72365+1219kdocker-v29.9.32026-11-10 20:19 UTC