需要 Python 3.11 到 3.13;在 notebook 里要用 %pip install retentioneering;自带示例数据需通过 rete.datasets.load_ecom() 加载
retentioneering-tools
retentioneeringApache-2.0活跃维护用 Python 做点击流和事件日志分析的工具包,支持用户旅程、行为分群、A/B 测试和马尔可夫链模拟,还能让 AI 代理复现并交叉验证分析结果。
Python toolkit, MCP server, and agent skills for reproducible, auditable clickstream and event log analytics. Helps AI agents, data scientists and analysts build, validate, and cross-check product analytics, quantitative UX, customer journeys, graph-based user flows, behavioral segmentation, A/B tests, process mining models, Markov chain simulation
v5.3.0发布于 2026-10-27 16:14 UTC946star +2 / 7 天144fork同步于 2026-11-10 23:52 UTC
从事件日志分析用户行为路径的 Python 库,帮你定位卡点、对比分组路径并发现行为模式
用 Python 做点击流和事件日志分析的工具包,支持用户旅程、行为分群、A/B 测试和马尔可夫链模拟,还能让 AI 代理复现并交叉验证分析结果。
核心能力
- 用转移图对比不同分组的路径概率差异
- 用漏斗按会话统计有序步骤的完成率
- 用 Step Matrix 和 Step Sankey 对齐关键事件前后步骤
- 用 filter_paths 按路径模式筛选目标会话
- 用聚类分析按事件计数等指标划分行为分群
容易踩的坑
内容由模型根据 README 生成,可能不完整或不准确,以官方文档为准。看原文 README
- v5.3.0最新正式版2026-10-27 · 2026-10-27 16:14 UTC
Added
- Path patterns accept the regex quantifier family on gaps:
.{m,n},{n},{m,},{,n},+and?after.or a class, alongside*. Bounds are inclusive and count the events strictly between the anchors, soadd_to_cart->.{0,4}->purchaseis "bought within five steps", andcart->[shipping|payment]+->purchaseno longer matches an adjacent cart/purchase the way*does. A bounded gap takes no ordinal, soat=and Step Matrix centring are unchanged (#110). - Round-bracket groups repeat a sequence:
(B->.*->C->.*){2}is unrolled into two copies before matching.{k,}and+are accepted where a.*absorbs the extra repetitions; an upper bound is rejected with theNOTcondition that expresses it, and a group whose copies would be glued back to back despite a gap inside ((B->.*->C){2}) is rejected with both readings. Step Sankey lays its blocks out from the unrolled pattern, so each copy gets a block of its own. - Condition leaves for 0/1 metrics have a shorthand:
{"has_event": "purchase"},{"matches_pattern": "A->.*->B"},{"has_any_event": ["A", "B"]}, or{metric: metric_args}for any ofhas_event,has_any_event,has_all_events,matches_pattern,in_segment. Each means{"op": "=", "metric": ..., "metric_args": ..., "value": True}, and works infilter_paths, in MCPfilter_pathssteps, and incollapse_eventsname cases for the 0/1 metrics those support (has_event,has_any_event,has_all_events). method_argsof the"kmeans"method acceptsn_init("auto"or a positive int, default"auto") andrandom_state(int or None, default 42) on all three clustering surfaces (add_clusters,cluster_analysis_data,cluster_analysis). The library used to hard-code scikit-learn's single k-means++ run, so the same features clustered under another seed could land in a different local optimum and there was no way to ask for more initialisations;n_init=10now does that. The values you pass are carried intobest_params, so the savedadd_clusterscall reproduces the split. Defaults are unchanged.transition_graph(label_scale=...)scales every node and edge label on the canvas (0.5–3, default 1), since the default sizes read too small on slides and in screenshots. HTML exports keep the scale.
Changed
- Segment Overview and Cluster Analysis tables group the rows of a bulk metric
(
event_count_bulk,has_event_bulk,in_segment_bulk) under one collapsible header such asevent_count_bulk · mean, and label each row with just its event or segment level, instead of repeating the metric and aggregation on every row.
Fixed
-
A condition node with no
opthat is not a shorthand leaf now raisesPreprocessingConfigErrornaming the node, instead ofAttributeError: 'NoneType' object has no attribute 'upper'. -
Cluster Analysis Save/Copy use the features and path column from the displayed analysis even after sidebar edits. Copied code explicitly preserves
scaler=None, and clearing a result also clears its saved call. -
Cluster Analysis records the realized seed for
random_state=Noneinbest_params, so saving clusters replays the displayed split. The widget persists its KMeans settings and current seed instate_file; grid selection and restoration reuse that seed, while a new Apply chooses a fresh one. -
describe()["segments"]reports the events that have no value for a segment column under the<MISSING>sentinel, the same levelget_segment_levelslists. Those events used to be dropped, and becausesharewas normalized over the remaining rows it still summed to 1.0 — a segment built withadd_segment(func=...)that left 3 of 5 events unassigned reported a 50/50 split instead of 20/20/60, with nothing marking the table as partial. The docstring now states that these counts are over events, not paths ([#188](https://github.com/retentioneering/retentio
- Path patterns accept the regex quantifier family on gaps:
- v5.2.42026-10-07 · 2026-10-07 13:06 UTC
查看更新说明
Changed
- Links in an MCP report's analysis text now leave a visible mark on Step Matrix and Segment Overview cells. A link used to tint its cell pale yellow for about a second, which on a heatmap was hard to tell apart from the cells around it, so a reader clicking
[Tab:event@step]or[Tab:metric@segment]often could not see which number the text meant. The cell now flashes a stronger yellow and keeps an amber outline until the next link into the same widget or a click inside it; a segment column link outlines the whole column. Transition graph links are unchanged
Fixed
- Step Sankey now draws
anchor=correctly. The data was always right, but the diagram took its layout only frompath_pattern, so with an anchor spec the centre block was labelledpath_startand no ribbons led into it from the left —step_sankey(anchor="payment_error")looked like a diagram of session starts. The widget now centres the block on the anchored event (atandoccurrenceincluded), showsstep_windowcolumns on both sides, and for an anchor with anoffset, where step 0 is no longer one fixed event, draws step 0 as an ordinary column.path_patterndiagrams are unchanged - Transition Graph no longer raises
Cannot read properties of null (reading 'isHeadless')during initial rendering when a graph rebuild destroys an instance before its scheduled viewport fit runs. Deferred fit and resize callbacks now check that their graph is still the active, live instance before using it. - The MCP server's
add_transition_graphandadd_step_matrixtools once again tell the agent what the tab shows. The tab itself always rendered correctly, but the summary returned alongside it — the only part of the result the agent reads — came back empty ({"n_events": 0, "top_edges": []}), with and withoutdiff, because it still looked for the widgets' result under a key they had since renamed fromevent_groupstoevents. An agent writing a report was therefore interpreting graphs and step matrices it had never seen. Both summaries read the current keys now. A step matrix with apath_patternhas one block per pattern segment, each with its own step axis, and the summary used to cover only the first; it now returns ablockslist with one entry per segment, in pattern order. Tests now run both tools on the bundled ecom dataset and fail on an empty summary, so a future rename of these keys breaks the build instead of silently leaving the agent without data
- Links in an MCP report's analysis text now leave a visible mark on Step Matrix and Segment Overview cells. A link used to tint its cell pale yellow for about a second, which on a heatmap was hard to tell apart from the cells around it, so a reader clicking
- v5.2.32026-09-25 · 2026-09-25 09:28 UTC
查看更新说明
Fixed
- Transition Graph no longer sits on its "Updating graph..." spinner after "Run all". The graph asked the kernel for its node layout only once it was on screen, and that request waits in the same queue as the cells, so under "Run all" it was answered only after the whole notebook had finished, which in a long notebook meant many minutes of spinners. The layout is now computed together with the graph and arrives with it, so the graph is drawn right away no matter what the kernel is busy with. Running cells one by one looks exactly as before
- v5.2.22026-09-17 · 2026-09-17 21:52 UTC
查看更新说明
Fixed
-
Installing in Google Colab no longer asks you to restart the session. 5.2.1 raised the
ipywidgetsfloor to>=8.0; Colab ships 7.x and imports it while the kernel starts, sopip install retentioneeringupgraded it and pip then required a restart before anything would work — on a fresh notebook, before you had typed a line. The floor is>=7.7now, which Colab's own version already satisfies, so nothing is upgraded and nothing has to be restarted -
A correction to what the 5.2.1 entry below claims. It says the old
ipywidgets>=7.0floor meant every widget method failed withModuleNotFoundError: No module named 'ipython_genutils'. That holds only for 7.6.0 through 7.6.3, which do not listipython-genutilsamong their dependencies, so nothing installs it; 7.6.5 and later — including the 7.7.x that Colab ships — do list it, and work. The version that surfaced the failure was chosen by resolving our declared floors at their minimum, which is not a resolution any user gets. So the defect was a floor that admitted those three releases, and>=7.7is the narrow fix for it;>=8.0was more than the problem called for and cost Colab users a restart for nothing
-
- v5.2.12026-09-17 · 2026-09-17 20:53 UTC
查看更新说明
Changed
-
The MCP server now runs on version 2.x of the MCP Python SDK (
mcp[cli]>=2.2,<3). Nothing changes in how you start it or connect to it:rete.mcp.serve(stream, port=8765)takes the same arguments, the server URL is stillhttp://localhost:8765/sse, and existing agent configs keep working. What changed is inside the SDK — its server class was renamed and the transport options moved out of the constructor intorun(), so the three lines naming them moved too. The reason to bound the version at all: 5.2.0 asked formcp[cli]>=1.28.0with no upper bound, so a fresh install began picking up 2.x on its own the day it was published, which is not a major anyone had tested against. In an environment that already had an HTTP stack installed — Google Colab, or any long-lived environment — that also leftpipreportinghttpcore 1.0.5 requires h11<0.15, but you have h11 0.16.0: mcp 2.x renamed its HTTP dependencies tohttpx2/httpcore2, so the olderhttpcorewas left behind rather than upgraded, whileh11, whose name did not change, was bumped for the new one. Nothing was broken in retentioneering itself, but the warning is alarming and the strandedhttpcorereally is unusable, which can break unrelated libraries in the same notebook. The SDK version is bounded to the tested major now, andhttpcoreis named as a dependency of its own — it is not imported anywhere, it is there so the resolver upgrades that leftover copy instead of stranding it.pip install retentioneeringinto a Colab notebook is quiet again, and CI now checks exactly this by installing the package into a deliberately pre-populated environment and runningpip check -
MCP tool calls are serialized. Version 2.x of the SDK runs synchronous tool handlers on worker threads rather than inline on the event loop, so two calls from one agent can now overlap — and every tool writes to the same session state: the active stream, the preprocessors applied to it, and the list of report tabs waiting to be exported. An
export_reportarriving while anadd_transition_graphwas still registering its tab could have published a report without that tab, or with a tab computed from a stream another call had just replaced. One tool now runs at a time, which is what 1.x did implicitly by never threading them
Fixed
-
The package asked for
ipywidgets>=7.0, which was never true. With ipywidgets 7.x in the environment, every widget method —transition_graph(),step_matrix(), the rest — failed withModuleNotFoundError: No module named 'ipython_genutils', because 7.x reaches for a module that no longer ships. Importing the library was fine, since widgets are imported lazily inside the methods, so the floor looked harmless until the moment you asked for a picture. Nothing downstream corrected it either:anywidgetitself declaresipywidgets>=7.6.0. The floor is>=8.0now, which is what the library has actually needed all along — an environment that satisfied only the old floor gets ipywidgets upgraded on the next install instead of a widget layer that cannot import -
Transition Graph in diff mode felt stuck once a stream had a lot of different events. To give each node its colour, the widget added up both group matrices again for every single node on screen. Those two sums are the same whichever node you ask about, so the work grew with the cube of the number of events. With 600 different events one redraw read about 430 million numbers and took roughly 7 seconds. That redraw is not only the first paint. It runs again every time you move a slider, hide or pin a node, or switch the theme. The sums are now worked out once when the data arrives, in a single walk that also gives the total of the matrix, and asking for one nod
-
用户点评
登录用户的真实使用记录,可按版本和硬件筛选共 0 条
还没有人点评。第一个说出真实体验的人最有价值。
Retentioneering
Retentioneering is an open-source Python library for understanding user behavior from event logs. Find where users get stuck, compare the paths different groups take, and discover patterns across clicks, sessions and repeat visits. Explore the data yourself or let an AI agent work with the same tools.





Run a demo notebook in Google Colab – no need to install the library locally, sample data included.
Quick start · Use cases · Use an AI agent · Docs
A demo of the interactive features of the transition graph widget. You can highlight a route, compare path groups, focus on the step you want to investigate, and explore incoming and outgoing transition probabilities in the ego view.
Is it for you?
Use Retentioneering when you have a question about the sequence of actions like these:
- A metric changed. Where did journeys change and move the metric?
- Users stop before reaching a goal. What do they do instead and how do successful paths differ?
- You want to understand engagement. What behavior types are represented, and how does usage evolve across visits?
- You need to investigate a flow. Where do checkout, onboarding, support or agent runs loop, branch or stall?
Bring an event-level export from your analytics platform, warehouse or application logs. All you need is a user, session or case ID; an event name; and a timestamp.
Quick start
Python: 3.11 - 3.13.
Environment: Jupyter (Jupyter Notebook, JupyterLab, JupyterLab Desktop), VS Code, Cursor, Google Colab.
To install the library, run
pip install retentioneering
Within a notebook, use %pip install retentioneering instead. See the installation guide for the details.
To try out the library quickly, without loading your own data, you can use a built-in e-commerce dataset:
import retentioneering as rete

stream = rete.datasets.load_ecom()  # bundled synthetic store
stream.transition_graph()
Common use cases
Below are a few examples of how you can apply retentioneering tools to approach common analytical problems on the bundled e-commerce demo dataset. The code chunks assume stream = rete.datasets.load_ecom().
Create a binary segment that cuts each path at the boundaries of the affected period: its events inside the period are labelled inside, the rest outside, so one path can contribute to both parts. Then compare user behavior across these parts with the transition graph widget.
periods = stream.add_segment("period", time_range=("2024-05-19", "2024-06-07"))
periods.transition_graph(diff=("period", "inside", "outside"))
Click a node (e.g. payment_details) to inspect the routes that pass this node. With this comparison configuration, red means a higher next-step probability inside the period; blue means lower. This locates a behavioral difference to investigate.
Letting a path contribute to multiple levels of a segment gives more flexibility to diff mode: you can compare not only common attributes like mobile vs. desktop, acquisition channels, or experiment groups, but dynamic features as well: first session vs. the others, weekends vs. weekdays, etc.
Count sessions that complete the steps in order – rather than whole user journeys (path_col="session_id") – with the funnel widget:
steps = ["cart", "shipping_details", "purchase"]
stream.funnel(steps=steps, path_col="session_id")
Then compare sessions that stopped at the shipping stage of this funnel with those that completed it using the step matrix widget in diff mode:
(
    stream
        .add_segment("stage", funnel_events=steps, path_col="session_id")
        .step_matrix(
            path_pattern="cart->.*->shipping_details",
            step_window=2, path_col="session_id",
            diff=("stage", "shipping_details", "purchase"),
        )
)
The path_pattern="cart->.*->shipping_details" argument of the step matrix breaks down the diagram into two parts: around cart and around shipping_details. You can inspect these surroundings and compare sessions that reached shipping_details but not purchase with those that completed the funnel.
Instead of using traditional tree-like diagrams for path exploration, you can use Step Sankey, which shows the same numbers as a Step Matrix, drawn as flows. In this example, we align all the paths by the payment_error event and display the two steps on either side of it:
stream.step_sankey(
    anchor="payment_error", step_window=2,
    path_col="session_id",
)
A plain event name anchors each path on its first occurrence. An anchor spec chooses the position more precisely: which occurrence to use, which event of a pattern to center on (at), or how far to shift from it (offset). For example, align sessions on their last payment error to see whether users recover after it or give up:
stream.step_sankey(
    anchor={"pattern": "payment_error", "occurrence": "last"},
    step_window=2, path_col="session_id",
)
After the last error, sessions end more often than after the first one: two steps later, path_end takes 41% instead of 32%. Either way, the next step is almost always support_chat (89%).
Find sessions that opened the cart, then ended without reaching shipping or support:
abandoned = stream.filter_paths(
    {"metric": "matches_pattern", "op": "=", "value": True,
     "metric_args": {
         "pattern": "cart->[^shipping_details|support_chat]*->path_end"
     }},
    path_col="session_id",
)
abandoned.step_sankey(path_pattern="cart", path_col="session_id", step_window=3)
The filter_paths data processor can filter paths according to a path metric value, such as length, duration, event count, etc. In our case we use the matches_pattern metric that checks if a path matches the regex-like pattern cart->[^shipping_details|support_chat]*->path_end.
To explore clusters interactively, start with a bare call of the Cluster Analysis widget and set everything up in its sidebar:
stream.cluster_analysis()
Here users are clustered by event_count_bulk, which expands into one count per event type, over a grid of 3 to 8 clusters scored by the silhouette metric. The heatmap compares mean metric values across clusters (blue for lower values, red for higher). Overview metrics such as length or in_segment_bulk describe the clusters without changing the features used for clustering. Pick another partition on the Silhouette tab if you are not satisfied with the silhouette-best split. Once you find an optimal split, label the clusters in the header, click Save Clusters and save them as a segment.
The same configuration can also be passed directly:
stream.cluster_analysis(
    features=[{"metric": "event_count_bulk"}],
    method_args={"n_clusters": "3-8"},
    overview_metrics=[
        {"metric": "event_count_bulk"},
        {"metric": "length"},
        {"metric": "in_segment_bulk", "metric_args": {"segment_name": "acquisition_channel"}},
    ],
)
And the partition saved in the GIF above – four clusters, renamed – becomes a segment column with add_clusters and rename_segment_levels:
user_types = (
    stream
        .add_clusters(
            "user_type", features=[{"metric": "event_count_bulk"}],
            method_args={"n_clusters": 4},
        )
        .rename_segment_levels("user_type", {
            "cluster_0": "browsers",
            "cluster_1": "researchers",
            "cluster_2": "buyers",
            "cluster_3": "light_users",
        })
)
Once clusters are saved as a segment, explore them like any other segment: compare them in the diff mode of any widget or side by side in Segment Overview.
Cluster sessions according to behavioral types like this:
stream.cluster_analysis(
    features=[{"metric": "event_count_bulk"}],
    method_args={"n_clusters": "4-8"},
    path_col="session_id"
)
Suppose 4 clusters look best. add_clusters reproduces that split as the session_type segment – the same result as Save Clusters in the widget. Then we can collapse sessions and treat them as single events with the collapse_events data processor and visualize the session flow with any widget, such as the transition graph:
visits = (
    stream
        .add_clusters(
            "session_type", features=[{"metric": "event_count_bulk"}],
            method_args={"n_clusters": 4}, path_col="session_id",
        )
        .collapse_events(group_col="session_id", name={"col": "session_type"})
        .rename_events({
            "cluster_0": "browsing",
            "cluster_1": "quick_visit",
            "cluster_2": "purchase_visit",
            "cluster_3": "promo_visit"
        })
)
visits.transition_graph()
See more analysis recipes in the docs.
Bring your own data
The minimum input is a table with three columns – user_id, event and timestamp:
| user_id | event | timestamp |
|---|---|---|
| user_1 | signup | 2026-01-01 10:00:00 |
| user_1 | project_created | 2026-01-01 10:02:00 |
| user_1 | teammate_invited | 2026-01-01 10:05:00 |
Retentioneering uses the Eventstream class to store data and to provide access to all the library's methods.
import pandas as pd
import retentioneering as rete

events = pd.read_csv("events.csv", parse_dates=["timestamp"])
stream = rete.Eventstream(events)
stream.transition_graph()
Use a schema to map other column names, declare path segments or pre-existing sessions. Any dataset readable by pandas – such as CSV, Parquet or the result of a warehouse query – can become an eventstream.
These are starting points for common exports; check identity and timestamp fields in your actual data.
| Source | Path ID | Event | Timestamp |
|---|---|---|---|
| GA4 BigQuery | user_pseudo_id | event_name | event_timestamp (microseconds) |
| Amplitude | user_id or amplitude_id | event_type | event_time |
| Mixpanel | properties.distinct_id | event | properties.time (Unix seconds) |
| Segment tracks | user_id or anonymous_id | event | timestamp |
Flatten nested properties and convert numeric timestamps to datetimes with the correct unit before loading. For example, after exporting the three GA4 fields above to a DataFrame named ga4:
ga4["event_timestamp"] = pd.to_datetime(ga4["event_timestamp"], unit="us")
stream = rete.Eventstream(ga4, schema={
    "path_cols": ["user_pseudo_id"], "event_col": "event_name",
    "timestamp_col": "event_timestamp",
})
Common analysis workflow
- Prepare paths. Data processors filter events or whole journeys, split sessions, collapse repeated actions and define segments. Each returns a new eventstream, so steps chain into a pipeline.
- Explore. Interactive widgets show paths as graphs, step matrices, Sankey diagrams, funnels and clusters, and compare any two groups.
- Build your own outputs. Every widget has a headless
*_data()twin that returns the numbers behind the chart, for custom charts, reports and checks. - Share.
export_html()saves a widget as a standalone interactive page that opens without Python.
Explore agent runs, conversations and other event sequences
A path doesn't have to be a user journey. Treat each agent run as a path and its internal steps – tool calls, retries, errors, validations – as events, then use the same tools to see where runs loop, recover or fail, and how successful runs differ from failed ones. See the agent-run example notebook (open in Colab) for a synthetic walkthrough.
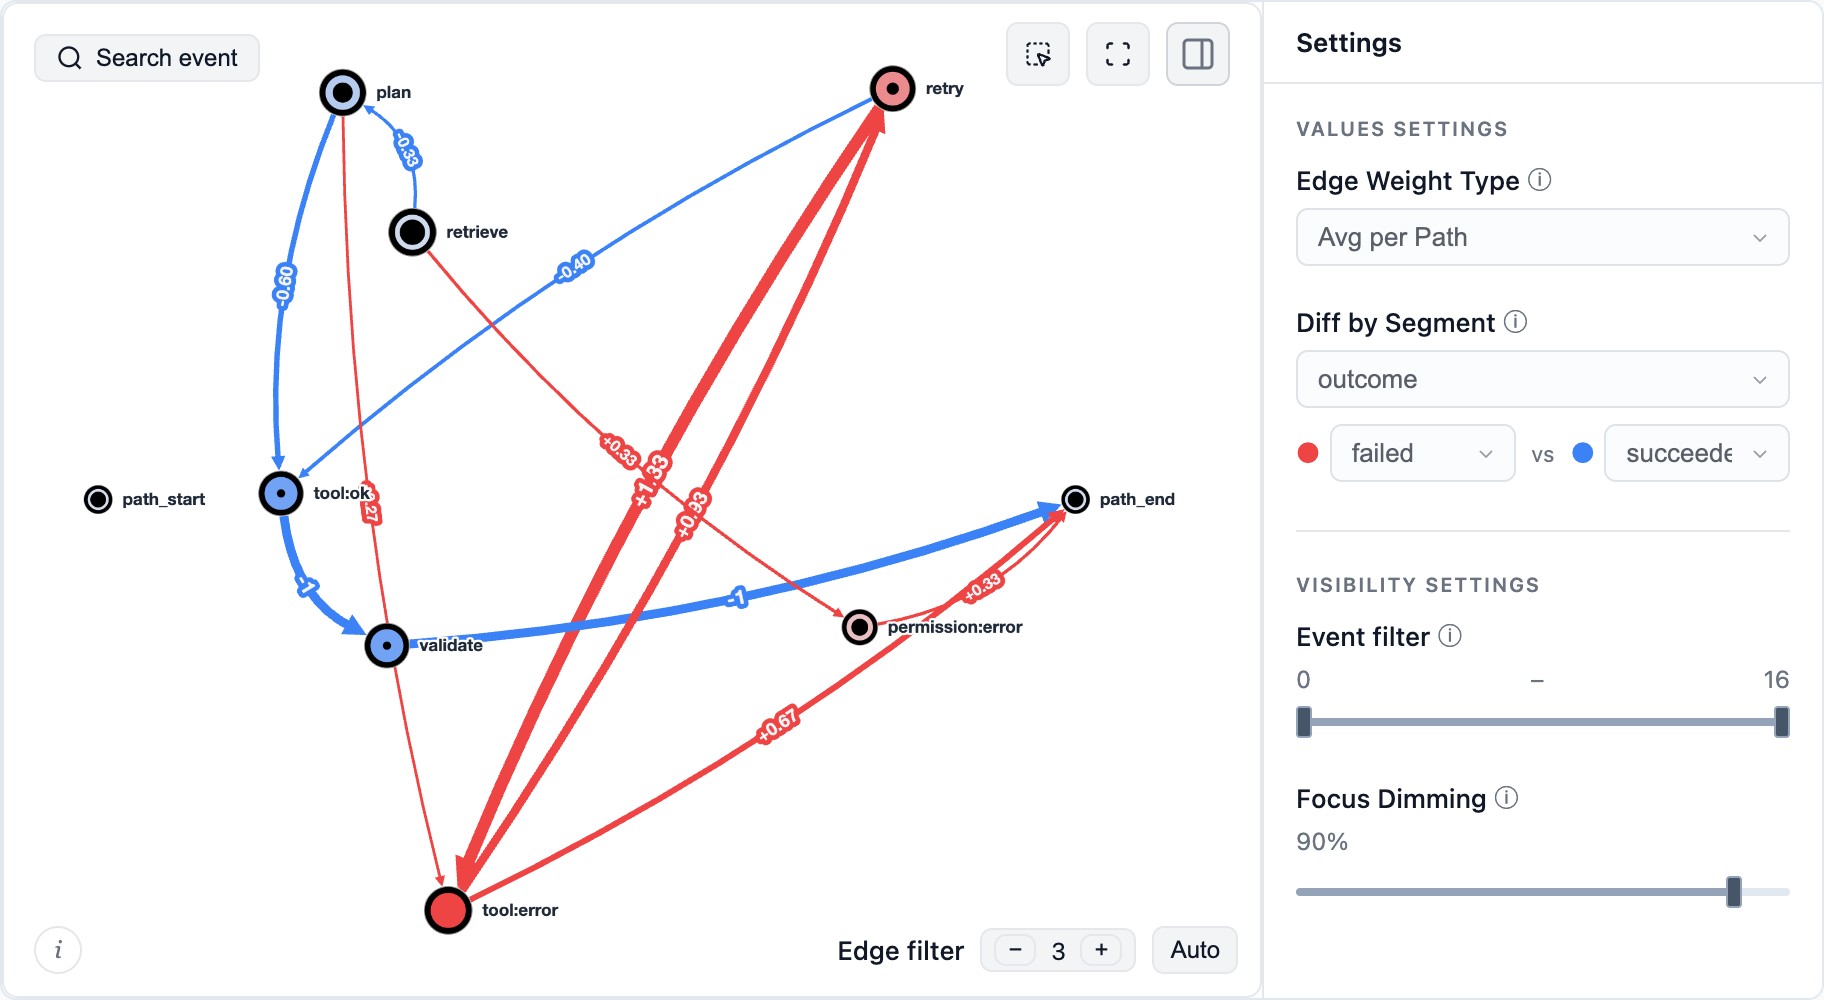
The same approach works for other processes: decide what one path is and which steps become its events. For example:
- Support conversations: a path is the sequence of message intents and handoffs within one conversation, e.g.
billing_question → bot_answer → rephrased_question → escalation → agent_answer → resolved. - Tickets: a path is the sequence of a ticket's status changes and reassignments, e.g.
opened → triaged → assigned:tier1 → waiting_for_customer → reassigned:tier2 → closed. - Learning sessions: a path is the sequence of lessons, attempts and their results within a study session or across a learner's whole course, e.g.
lesson_3 → quiz_3:fail → lesson_3_review → quiz_3:pass → lesson_4.
Work with an AI agent
Give your coding agent the product-analytics skill and an event file. The skill guides it through inspecting the log, choosing a recipe, running the analysis and checking the result. See skill setup for supported workflows.
For example:
Use Retentioneering to investigate where sessions in events.csv stall between cart and purchase. Check the schema and event order first. Compare sessions that purchased with those that stopped, keep non-purchasing sessions, and show the counts behind the main differences. Return the runnable analysis and an interactive HTML report.
Prefer an MCP connection? The data MCP server (beta) exposes an Eventstream to a compatible agent from a local Python environment. Its report collects several tools in tabs and links every number in the text to the element it comes from – a graph edge, a step matrix cell or a segment overview cell:
- Read the current API index, full text docs or documentation MCP guide. Documentation access supplies reference material; data analysis also needs Python execution and access to the event file.
- This README uses 5.x. Start with
import retentioneering as reteandrete.Eventstream(df, schema={...}). Older 2.x/3.x examples use a different API. - Choose and declare the path grain (
path_cols); passpath_colto analyses when switching between users and sessions. Declare comparison columns insegment_cols. - Use
transition_graph,step_matrix,step_sankey,funnel,segment_overviewandcluster_analysis. Their*_data()methods return computed results for inspection and automation; return types vary by tool. - Graph, matrix, Sankey and funnel comparisons take
diff=("segment", "A", "B")and show A minus B. Check group sizes, metric definitions and the corresponding data output. - Processors return a new Eventstream. Assign the result, preserve the intended event order and population, and validate a complete sequence with a path pattern rather than inferring it from separate graph edges.
- Save and replay transformations with Eventstream.recipe(). Keep findings separate from hypotheses about their causes.
Telemetry
Anonymous usage telemetry is enabled by default. Sensitive data like event names, identifiers, path contents and parameter values is never sent; see what is collected. Set RETENTIONEERING_NO_TRACK=1 before starting Python to disable it.
Documentation and community
Quick start · Eventstream · Widgets · Data processors · Analysis recipes
Using a 3.x example? Version 5 rewrites the API. See the migration guide; legacy Sequences, Cohorts, StatTests and the visual Preprocessing Graph remain on the 3.x branch.
Bring a question, a useful recipe or a small reproducible example to GitHub issues, Discord or Telegram. Contributions to methods, widgets, examples and agent workflows are welcome – see CONTRIBUTING.md.
Apps are better with math. Join us!
Citing Retentioneering
If you use Retentioneering in your research, please cite it:
@software{retentioneering,
  title   = {Retentioneering: understanding user behavior from event logs},
  author  = {Godzi, Maxim and Kukushkin, Vladimir and Zaytsev, Anatoly},
  year    = {2026},
  url     = {https://github.com/retentioneering/retentioneering-tools},
  license = {Apache-2.0},
}
License and commercial model
Retentioneering-tools is open-source software licensed under the Apache License, Version 2.0.
Retentioneering is a community research laboratory dedicated to developing new analytics methodology and open-source tools.
Copyright retentioneering-tools v.5.0 Maxim Godzi, Vladimir Kukushkin and Anatoly Zaytsev. Updates may include software developed by the Retentioneering community.
You are free to use, modify, distribute, and build commercial products with Retentioneering-tools, subject to the terms of the Apache-2.0 license.
Other Retentioneering libraries, packages and managed execution services, enterprise integrations, premium diagnostic workflows, and hosted collaboration features are separate proprietary products and are governed by their respective commercial terms. Additional details are provided in COMMERCIAL.md.
The Apache-2.0 license applies only to the source code and assets distributed in this repository. It does not grant rights to use the Retentioneering name, logo, trademarks, hosted services, proprietary cloud infrastructure, or commercial content that is not distributed in this repository.
We welcome contributions from individuals and organizations. Contributions to Retentioneering-tools are accepted under the contribution terms described in CONTRIBUTING.md.
Our goal is to keep the core analytical language and ecosystem open, extensible, and useful for independent analysts, researchers, startups, and enterprise teams, while funding long-term maintenance through optional commercial products and services.

netdata
netdata·Go
开箱即用的全栈监控平台,秒级采集指标并自动告警,内置机器学习异常检测,小团队也能低成本搭建可观测性。
全栈监控+4分析 / BI
81354+586.7kv2.12.32026-11-10 21:41 UTC
TrendRadar
sansan0·Python
聚合多平台热点与 RSS 订阅,用 AI 做关键词筛选、翻译和简报分析,并通过微信、飞书、钉钉等渠道推送到手机,帮你摆脱信息过载。
舆情监控+4分析 / BI
63574+7625k2026-11-05 00:47 UTC

best-of-ml-python
lukasmasuch
每周更新的机器学习 Python 库排行榜,按类别和评分整理优质库,帮你快速找到 AutoML、深度学习、数据可视化等方向的趁手工具。
机器学习库+4分析 / BI
23860+23.1k2025.10.302026-11-05 14:09 UTC
vanna
vanna-ai·Python
🤖 Chat with your SQL database 📊. Accurate Text-to-SQL Generation via LLMs using Agentic Retrieval 🔄.
分析 / BI
238062.5k2026-02-02 14:14 UTC