需要自行注册并认证 Google Earth Engine 账号才能调用 GEE 服务;交互式地图依赖 Jupyter 环境(ipyleaflet、ipywidgets),在纯脚本或非 Notebook 环境无法显示;README 未说明默认端口等细节。

geemap
gee-communityMIT活跃维护用 Python 封装 Google Earth Engine,在 Jupyter/Colab 里做交互式地理空间分析与可视化,省去手动拼 GEE 代码的麻烦。
A Python package for interactive geospatial analysis and visualization with Google Earth Engine.
v0.38.9发布于 2026-10-01 16:02 UTC4,071star +3 / 7 天1,159fork同步于 2026-11-10 17:40 UTC
pip install geemap 硬件要求按 README 说明
README 未说明硬件要求;geemap 基于 Jupyter 环境运行,计算由 Google Earth Engine 云端完成,本地无需 GPU 显存。
在 Jupyter 里交互式分析和可视化 Google Earth Engine 数据的 Python 包
用 Python 封装 Google Earth Engine,在 Jupyter/Colab 里做交互式地理空间分析与可视化,省去手动拼 GEE 代码的麻烦。
核心能力
- 用 ipyleaflet 和 ipywidgets 在 Jupyter 中交互式显示 GEE 数据图层
- 提供 Map.addLayer、Map.setCenter 等仿 JavaScript API 风格的 Python 函数
- 把 Earth Engine JavaScript 脚本自动转换为 Python 脚本和 Notebook
- 用绘图工具和 Inspector 交互检索 GEE 数据并做分区统计
- 导出 Image 和 ImageCollection 为 GeoTIFF,导出 FeatureCollection 为 shp、csv 等格式
容易踩的坑
内容由模型根据 README 生成,可能不完整或不准确,以官方文档为准。看原文 README
- v0.38.9最新正式版2026-10-01 · 2026-10-01 16:02 UTC
What's Changed
- test: verify geemap entry presence in report without hardcoded prefix by @jdbcode in https://github.com/gee-community/geemap/pull/2893
- build(deps): bump github/codeql-action from 4.38.1 to 4.38.2 by @dependabot[bot] in https://github.com/gee-community/geemap/pull/2894
- fix(types): suppress pyrefly type errors in common and coreutils by @schwehr in https://github.com/gee-community/geemap/pull/2898
- build(deps): bump ip-address from 10.4.0 to 10.7.2 by @dependabot[bot] in https://github.com/gee-community/geemap/pull/2895
Full Changelog: https://github.com/gee-community/geemap/compare/v0.38.8...v0.38.9
- v0.38.82026-09-24 · 2026-09-24 19:01 UTC
查看更新说明
What's Changed
- build(deps): bump github/codeql-action from 4.37.9 to 4.38.1 by @dependabot[bot] in https://github.com/gee-community/geemap/pull/2891
- Update uv.lock to remove dependency-review vulnerabilities (cryptography, nbconvert, pymdown-extensions, wheel) by @jdbcode with @Copilot in https://github.com/gee-community/geemap/pull/2886
- build(deps): bump actions/setup-node from 4 to 7 by @dependabot[bot] in https://github.com/gee-community/geemap/pull/2883
- build(deps): bump pypa/gh-action-pypi-publish from 1.14.0 to 1.14.2 by @dependabot[bot] in https://github.com/gee-community/geemap/pull/2885
- build(deps): bump anyio from 4.8.0 to 4.14.2 by @dependabot[bot] in https://github.com/gee-community/geemap/pull/2890
- test: add coverage for rgb_to_hex by @soroushkarahrodi79-oss in https://github.com/gee-community/geemap/pull/2887
- test: cover get_colorbar behavior by @BuraakAI in https://github.com/gee-community/geemap/pull/2889
- build(deps): bump pygments from 2.19.1 to 2.20.0 by @dependabot[bot] in https://github.com/gee-community/geemap/pull/2892
New Contributors
- @soroushkarahrodi79-oss made their first contribution in https://github.com/gee-community/geemap/pull/2887
- @BuraakAI made their first contribution in https://github.com/gee-community/geemap/pull/2889
Full Changelog: https://github.com/gee-community/geemap/compare/v0.38.7...v0.38.8
- v0.38.72026-09-18 · 2026-09-18 21:38 UTC
查看更新说明
What's Changed
- ci: Default release workflow to draft releases and expand release documentation by @jdbcode in https://github.com/gee-community/geemap/pull/2881
- docs: streamline release documentation to single GitHub web UI path by @jdbcode in https://github.com/gee-community/geemap/pull/2882
- Suppress new Pyrefly findings before upgrading to v1.2.0 by @jgarcia525 in https://github.com/gee-community/geemap/pull/2888
Full Changelog: https://github.com/gee-community/geemap/compare/v0.38.6...v0.38.7
- v0.38.62026-09-11 · 2026-09-11 00:02 UTC
查看更新说明
What's Changed
- build(deps): bump github/codeql-action from 4.37.7 to 4.37.9 by @dependabot in https://github.com/gee-community/geemap/pull/2870
- build(deps): update jupyter-client requirement from <8.10 to <8.11 by @dependabot in https://github.com/gee-community/geemap/pull/2869
- build(deps): bump brace-expansion by @dependabot in https://github.com/gee-community/geemap/pull/2864
- ci: enable Pyrefly type checking in GitHub Actions by @jdbcode in https://github.com/gee-community/geemap/pull/2865
- build(deps): bump tornado from 6.5.7 to 6.5.8 by @dependabot in https://github.com/gee-community/geemap/pull/2871
- build(deps-dev): bump browserslist from 4.28.1 to 4.28.8 by @dependabot in https://github.com/gee-community/geemap/pull/2872
- build(deps): bump mistune from 3.3.0 to 3.3.3 by @dependabot in https://github.com/gee-community/geemap/pull/2873
- build(deps-dev): bump fast-uri from 3.1.5 to 3.1.7 by @dependabot in https://github.com/gee-community/geemap/pull/2874
- Unify docs dependencies in
pyproject.tomland switch docs workflows todocsextra by @jdbcode with @Copilot in https://github.com/gee-community/geemap/pull/2876 - build(deps-dev): bump js-yaml from 4.3.1 to 4.3.2 by @dependabot in https://github.com/gee-community/geemap/pull/2877
- ci: Modernize release workflow to dynamic versioning and direct master releases by @jdbcode in https://github.com/gee-community/geemap/pull/2880
Full Changelog: https://github.com/gee-community/geemap/compare/v0.38.5...v0.38.6
- v0.38.6rc1pre-release2026-09-03 · 2026-09-03 22:07 UTC
查看更新说明
What's Changed
- build(deps): bump github/codeql-action from 4.37.7 to 4.37.9 by @dependabot[bot] in https://github.com/gee-community/geemap/pull/2870
- build(deps): update jupyter-client requirement from <8.10 to <8.11 by @dependabot[bot] in https://github.com/gee-community/geemap/pull/2869
- build(deps): bump brace-expansion by @dependabot[bot] in https://github.com/gee-community/geemap/pull/2864
- ci: enable Pyrefly type checking in GitHub Actions by @jdbcode in https://github.com/gee-community/geemap/pull/2865
- build(deps): bump tornado from 6.5.7 to 6.5.8 by @dependabot[bot] in https://github.com/gee-community/geemap/pull/2871
- build(deps-dev): bump browserslist from 4.28.1 to 4.28.8 by @dependabot[bot] in https://github.com/gee-community/geemap/pull/2872
- build(deps): bump mistune from 3.3.0 to 3.3.3 by @dependabot[bot] in https://github.com/gee-community/geemap/pull/2873
- build(deps-dev): bump fast-uri from 3.1.5 to 3.1.7 by @dependabot[bot] in https://github.com/gee-community/geemap/pull/2874
- chore: Sync master version to 0.38.5.post0 by @github-actions[bot] in https://github.com/gee-community/geemap/pull/2875
Full Changelog: https://github.com/gee-community/geemap/compare/v0.38.5...v0.38.6rc1
用户点评
登录用户的真实使用记录,可按版本和硬件筛选共 0 条
还没有人点评。第一个说出真实体验的人最有价值。
geemap





A Python package for interactive geospatial analysis and visualization with Google Earth Engine
- GitHub repo: https://github.com/gee-community/geemap
- Documentation: https://geemap.org
- PyPI: https://pypi.org/project/geemap
- Conda-forge: https://anaconda.org/conda-forge/geemap
- 360+ GEE notebook examples: https://github.com/giswqs/earthengine-py-notebooks
- GEE Tutorials on YouTube: https://youtube.com/@giswqs
- Free software: MIT license
Join our Discord server 👇
Acknowledgment: The geemap project is supported by the National Aeronautics and Space Administration (NASA) under Grant No. 80NSSC22K1742 issued through the Open Source Tools, Frameworks, and Libraries 2020 Program.
Announcement
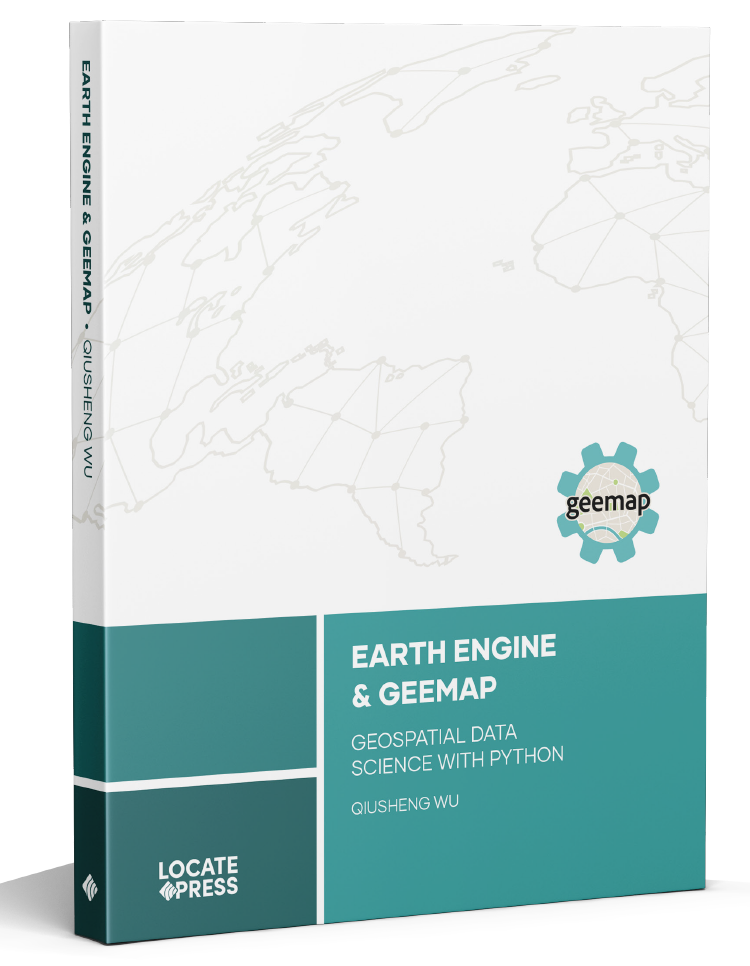
The book Earth Engine and Geemap: Geospatial Data Science with Python, written by Qiusheng Wu, has been published by Locate Press in July 2023. If you're interested in purchasing the book, please visit this URL: https://locatepress.com/book/gee.
Introduction
Geemap is a Python package for interactive geospatial analysis and visualization with Google Earth Engine (GEE), which is a cloud computing platform with a multi-petabyte catalog of satellite imagery and geospatial datasets. During the past few years, GEE has become very popular in the geospatial community and it has empowered numerous environmental applications at local, regional, and global scales. GEE provides both JavaScript and Python APIs for making computational requests to the Earth Engine servers. Compared with the comprehensive documentation and interactive IDE (i.e., GEE JavaScript Code Editor) of the GEE JavaScript API, the GEE Python API has relatively little documentation and limited functionality for visualizing results interactively. The geemap Python package was created to fill this gap. It is built upon ipyleaflet and ipywidgets, and enables users to analyze and visualize Earth Engine datasets interactively within a Jupyter-based environment.
Geemap is intended for students and researchers, who would like to utilize the Python ecosystem of diverse libraries and tools to explore Google Earth Engine. It is also designed for existing GEE users who would like to transition from the GEE JavaScript API to Python API. The automated JavaScript-to-Python conversion module of the geemap package can greatly reduce the time needed to convert existing GEE JavaScripts to Python scripts and Jupyter notebooks.
For video tutorials and notebook examples, please visit the examples page. For complete documentation on geemap modules and methods, please visit the API Reference.
If you find geemap useful in your research, please consider citing the following papers to support my work. Thank you for your support.
- Wu, Q., (2020). geemap: A Python package for interactive mapping with Google Earth Engine. The Journal of Open Source Software, 5(51), 2305. https://doi.org/10.21105/joss.02305
- Wu, Q., Lane, C. R., Li, X., Zhao, K., Zhou, Y., Clinton, N., DeVries, B., Golden, H. E., & Lang, M. W. (2019). Integrating LiDAR data and multi-temporal aerial imagery to map wetland inundation dynamics using Google Earth Engine. Remote Sensing of Environment, 228, 1-13. https://doi.org/10.1016/j.rse.2019.04.015 (pdf | source code)
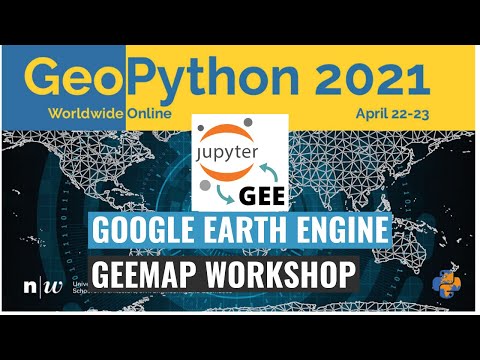
Check out the geemap workshop presented at the GeoPython Conference 2021. This workshop gives a comprehensive introduction to the key features of geemap.
Key Features
Below is a partial list of features available for the geemap package. Please check the examples page for notebook examples, GIF animations, and video tutorials.
- Convert Earth Engine JavaScripts to Python scripts and Jupyter notebooks.
- Display Earth Engine data layers for interactive mapping.
- Support Earth Engine JavaScript API-styled functions in Python, such as
Map.addLayer(),Map.setCenter(),Map.centerObject(),Map.setOptions(). - Create split-panel maps with Earth Engine data.
- Retrieve Earth Engine data interactively using the Inspector Tool.
- Interactive plotting of Earth Engine data by simply clicking on the map.
- Convert data format between GeoJSON and Earth Engine.
- Use drawing tools to interact with Earth Engine data.
- Use shapefiles with Earth Engine without having to upload data to one's GEE account.
- Export Earth Engine FeatureCollection to other formats (i.e., shp, csv, json, kml, kmz).
- Export Earth Engine Image and ImageCollection as GeoTIFF.
- Extract pixels from an Earth Engine Image into a 3D numpy array.
- Calculate zonal statistics by group.
- Add a customized legend for Earth Engine data.
- Convert Earth Engine JavaScripts to Python code directly within Jupyter notebook.
- Add animated text to GIF images generated from Earth Engine data.
- Add colorbar and images to GIF animations generated from Earth Engine data.
- Create Landsat timelapse animations with animated text using Earth Engine.
- Search places and datasets from Earth Engine Data Catalog.
- Use timeseries inspector to visualize landscape changes over time.
- Export Earth Engine maps as HTML files and PNG images.
- Search Earth Engine API documentation within Jupyter notebooks.
- Import Earth Engine assets from personal account.
- Publish interactive GEE maps directly within Jupyter notebook.
- Add local raster datasets (e.g., GeoTIFF) to the map.
- Perform image classification and accuracy assessment.
- Extract pixel values interactively and export as shapefile and csv.
databend
databendlabs·Rust
基于 Rust 重写的云原生数据仓库,统一支持分析、搜索、AI 与 Python 沙箱,直接架在 S3 上,省去多套系统拼装。
数据仓库+4GIS / 地图
9492901v1.2.961-nightly2026-11-10 16:35 UTC

RediSearch
RediSearch·Rust
给 Redis 加上二级索引、全文检索、向量相似度搜索和聚合能力的查询索引引擎,让 Redis 直接承担搜索与 RAG 检索场景。
向量数据库+4GIS / 地图
6245600v2.10.312026-11-10 17:28 UTC

segment-geospatial
opengeos·Python
用 Segment Anything 模型对遥感影像等地理空间数据做交互式分割的 Python 包,省去自己搭建分割流程的麻烦。
地理空间分割+4GIS / 地图
4204+3451v1.4.22026-11-09 20:52 UTC
geoai
opengeos·Python
面向地理空间数据的 AI 工具包,基于 PyTorch 提供遥感影像分割、地球观测分析等深度学习模型的训练与推理能力。
地理空间AI+4GIS / 地图
3464+2497v0.43.12026-11-09 03:05 UTC