不支持 macOS 预发布 beta 版本,修复只随正式版发布;远程机器需单独运行 install-agent.sh 安装 agent 并粘贴 sscope://pair 链接配对;应用读取私有 IOReport 接口,系统升级后指标可能暂时失效。
SiliconScope
kennssMIT活跃维护面向 Apple Silicon 的原生 SwiftUI 系统监控工具,无需 sudo 即可实时查看 ANE、媒体引擎和内存带宽占用,方便排查本地大模型推理时的硬件瓶颈。
Sudoless Apple Silicon system monitor (native SwiftUI GUI) with ANE / Media Engine / memory-bandwidth tracking
v4.8.1发布于 2026-11-02 13:32 UTC1,020star +2 / 7 天72fork同步于 2026-11-10 11:51 UTC
brew install --cask siliconscope 硬件要求按 README 说明
需要 Apple Silicon Mac,macOS 14 及以上;README 未说明具体内存或显存要求。远程 Linux/NVIDIA 机器通过 agent 接入,可查看 GPU 利用率、VRAM 与功耗。
纯 CPU 可运行支持 Apple Silicon
免 sudo 的 Apple Silicon 系统监控,原生 SwiftUI 界面,补齐活动监视器看不到的 ANE、媒体引擎和内存带宽
面向 Apple Silicon 的原生 SwiftUI 系统监控工具,无需 sudo 即可实时查看 ANE、媒体引擎和内存带宽占用,方便排查本地大模型推理时的硬件瓶颈。
核心能力
- 实时追踪 ANE、媒体引擎与内存带宽占用
- 按进程查看 CPU 的 P/E 核拆分、IPC、功耗和 ANE 内存
- 把全部指标录制为 .ssrec 文件,支持回放拖动时间轴
- 用瓶颈分类器判断带宽受限、算力受限或热降频
- 菜单栏按指标分项常驻,支持柱状、曲线等多种样式
容易踩的坑
内容由模型根据 README 生成,可能不完整或不准确,以官方文档为准。看原文 README
- v4.8.1最新正式版2026-11-02 · 2026-11-02 13:32 UTC
Fixes
- The "Memory swapping" warning — the banner, the red menu-bar icon and the notification — no longer fires when a single page is swapped out on a machine with plenty of free memory. It now needs swap-out above 64 pages/s (about 1 MB/s) for more than half of the last 3 seconds, at any refresh interval. A replayed recording shows the same verdict the live dashboard showed, and the menu bar's Swap-outs row turns red only above the same rate. (#88, #89, @iSaddam)
Agents unchanged: Linux 1.5.3, Mac 1.4.2.
- v4.8.02026-10-29 · 2026-10-29 05:29 UTC
查看更新说明
🧑💻 AI runtimes run by another account. When Ollama, oMLX or another runtime runs under a separate user — an
aiaccount serving models for you — SiliconScope now detects it and asks its API, as it does for your own. Python runtimes started from a venv on Homebrew's or python.org's Python (mlx_lm, vLLM, MTPLX …) and oMLX installed with pip are detected too, under any account. Other users' processes are used for detection only; the Processes card still lists yours. (#85, @martin-kufner)🎮 GPU processes in Fleet. On a Linux GPU box, each process now shows its share of the card (SM %), and graphics processes — a display server, a desktop shell — are listed with a label. Needs Linux agent 1.5.3.
Fixes
- The dashboard and menu bar could stop updating until the app was restarted, when a Bluetooth query for AirPods battery hung. That query now runs in the background with a time limit, and any part of sampling that stalls is logged by name. (#86, @Borda)
- On chips with no ANE state channel (M4 Pro, M2 Pro), the ANE row shows the engine's memory traffic instead of watts alone. (#87, @ebekebe)
sscope-cli --power-debugconverts each channel by its own unit: an M6's 0.014 W GPU no longer prints as 13,733 W. (#84)- Linux agent: LM Studio's log stream no longer keeps running after the agent is killed.
Agents: Linux 1.5.3, Mac 1.4.2 (other accounts' runtimes, and the time-limited tools above).
- v4.7.02026-10-19 · 2026-10-19 11:37 UTC
查看更新说明
🎛️ Every card in a multi-GPU box. A Linux machine with more than one NVIDIA card now shows each of them in Fleet: a chip per card with its load, memory and temperature, and the page below — charts, details, processes — describes the card you pick. Each card keeps its own history, so switching cards doesn't mix their charts. The overview tile charts up to two cards and lists the rest; the sidebar shows every card's load.
Processes on the card they actually use. The Linux agent matches each GPU process to its card by the card's UUID, so a job on GPU 1 is listed under GPU 1, and a process that uses two cards appears under both, with the memory it holds on each. Every process also shows the account it runs as — on a shared box, that is who holds the card. An older agent lists every process under the first card, as before.
🌐 Your local addresses. The Network section shows each interface's IPv4 and IPv6 addresses in its row; expand it for the full, copyable addresses. VPN and tunnel interfaces are listed under More addresses. Nothing is looked up online. (#79, @evn88)
Fixes — all four from @nova28:
- Fleet could crash the app while polling, when a connection was closed just as a request was about to use it. (#83)
- With notifications on and the window closed, the GPU throttle alert was judged on the last temperature and power measured while the window was open. It now measures them. (#81)
- A menu-bar dropdown now gives back its memory when it closes. Before, it held on to about 110 MB of graphics memory for the life of the app on a 5K display. (#80)
- A remote Mac whose GPU power is still pending, or that has no GPU sensor, no longer reads "0W · 0°C" in Fleet; the value is left out. (#82)
The Linux agent is now 1.5.0 for the per-card processes and accounts above; the Mac agent is unchanged at 1.4.1.
- v4.6.02026-10-16 · 2026-10-16 05:10 UTC
查看更新说明
🔌 Which network carries the traffic. The Network section lists each interface under the totals — Ethernet, Wi-Fi — with its own download and upload, the one carrying the default route first. An interface needs a routable address to be listed, so internal link-local-only interfaces stay out. The totals no longer count VPN tunnels: a
utuninterface (Tailscale, WireGuard) carries the same bytes your Wi-Fi or Ethernet already counts, so they were counted twice. (#74, @ticlazau)💾 What your SSD has done. The internal SSD's reads and writes since boot — from the storage driver's own counters, so they include everything before SiliconScope started — and over its lifetime. Its NVMe SMART readings, read-only: remaining rated endurance, temperature, spare capacity, media errors, and each critical warning by name rather than folded into a health score. On the dashboard's Disk card and the SSD menu. (#77, @evn88)
Disk sampling also got cheaper on the way: one driver enumeration and one read per tick serve both the activity rates and the new totals.
The Mac agent is now 1.4.1 for the network totals above; the Linux agent is unchanged at 1.4.0.
- v4.5.22026-10-05 · 2026-10-05 17:35 UTC
查看更新说明
Fleet stops polling when the sidebar is collapsed on This Mac. 4.5.1 polled whenever the window was on screen, but with the Devices sidebar collapsed and This Mac selected, no fleet data is shown anywhere — and the machines were still polled every 3 s. Now they are polled only while something shows them: the sidebar (each row is a machine's live summary), the Fleet overview, or a machine's page. Collapse the sidebar on This Mac and every agent connection closes; open it, or switch to Fleet, and polling resumes at once, with a break in the charts for the time in between. (#71)
用户点评
登录用户的真实使用记录,可按版本和硬件筛选共 0 条
还没有人点评。第一个说出真实体验的人最有价值。
SiliconScope
English · Deutsch · 简体中文 · 繁體中文 · 日本語 · 한국어


A sudoless Apple Silicon system monitor — a native SwiftUI dashboard and a full menu-bar suite — with first-class ANE (Neural Engine), Media Engine, and memory-bandwidth tracking that Activity Monitor and terminal monitors don't surface.
Born from wanting to see how on-device AI and media workloads drive the Apple Silicon accelerators — and grown into a daily-driver monitor that can stand in for iStat Menus.
New in 4.0 — it watches your other machines too. A headless Mac mini, a Linux GPU box under the desk, a rented cloud instance: run a small agent there and it joins the same dashboard, over an encrypted, paired connection. Remote Macs keep the full treatment, Neural Engine included.
Featured on OWC Rocket Yard (US), AAPL Ch. (JP), ifun.de (DE) and MacMagazine (BR).

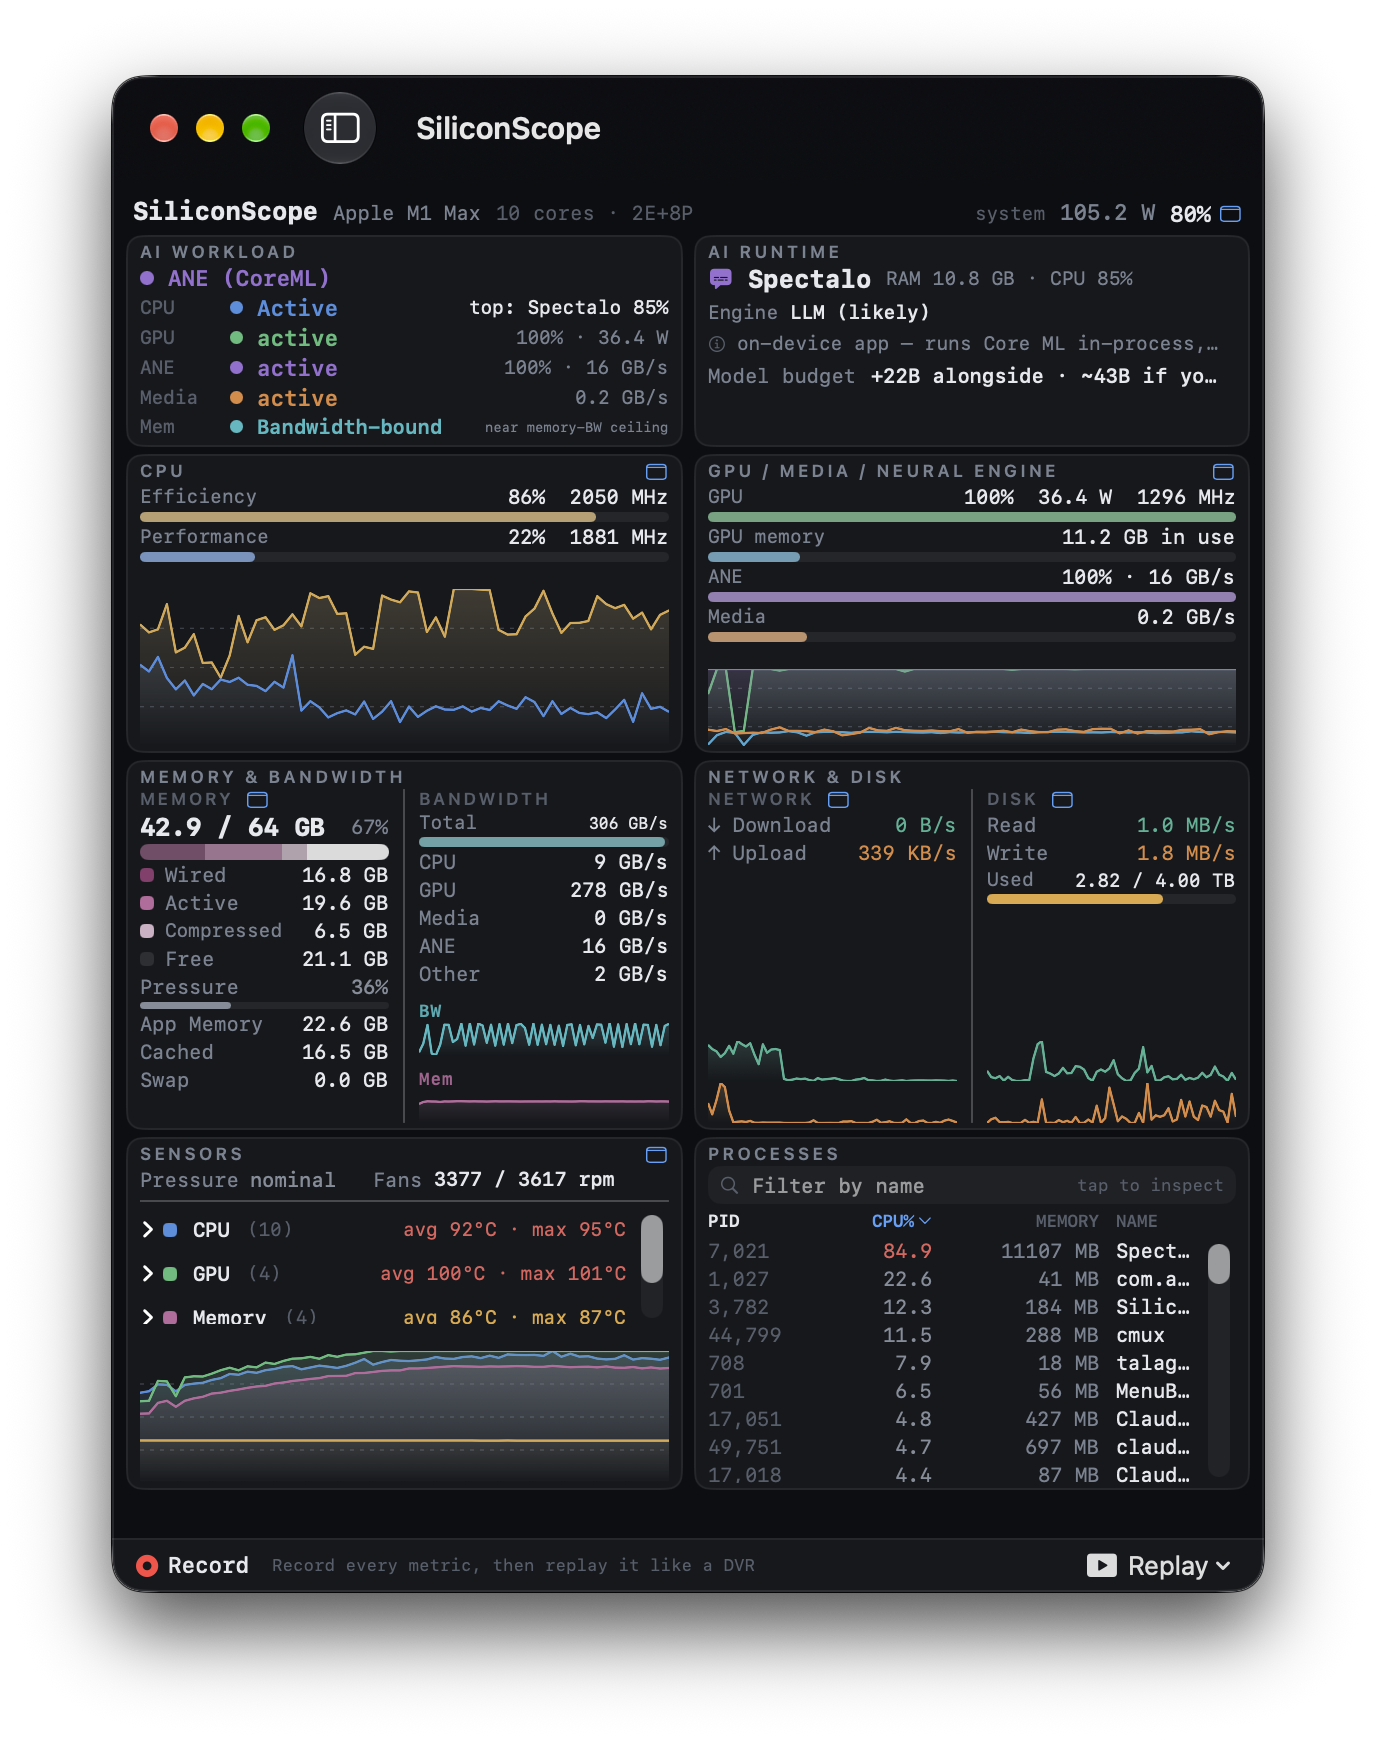
One M1 Max on macOS 27 under a real on-device AI load — Spectalo running its Core ML models. The workload classifier reads ANE (CoreML), and the Neural Engine is 100 % active, moving 16 GB/s — measured cluster residency, so it stays live even on macOS 27, where this chip's energy counters update only about every half hour. The GPU is at 100 % and 36 W, memory bandwidth is 306 GB/s against the chip's 400 GB/s ceiling (bandwidth-bound), and the header's system 105 W is the whole Mac's draw. Colour is spent only where something needs attention — here, red on CPU and GPU temperatures above 90 °C — and neutral everywhere else. The bar along the bottom is Replay (new in 3.0): every metric is recorded, so you can scrub back through a session like a DVR.
Menu bar — every metric, iStat-style
Pin any card to its own menu-bar item — CPU · GPU · Memory · Network · SSD · Sensors · Battery — each with a live glyph and a rich dropdown. Every item chooses its own style (bars · history graph · two lines · single value · icon) and which readings it draws, so a metric can even appear twice: CPU as bars and as a graph. All sudoless.

The richest dropdowns. GPU / Media / Neural — GPU, GPU memory, ANE and Media as live meters plus a four-line 60-second trend. Sensors — per-unit temperatures from real E-Core / P-Core / GPU / Memory sensors (curated SMC keys per chip generation, M1–M5; HID fallback elsewhere). SS cockpit — the whole machine in one dropdown: workload verdict, every engine, 60-second trends, and the top processes.

On-demand benchmark: "Measure tok/s" runs one short generation and reports the model's decode speed and energy efficiency — tokens/sec · tokens/Wh — stored per model.
📊 Measured tok/s on your Mac? Post it in Discussions — a crowd-sourced per-chip table helps others pick the right hardware.
New in 4.0
🛰 Fleet — your other machines, in the same dashboard
Run an agent on a remote box and it shows up in a Devices sidebar beside This Mac. Machines on your LAN are discovered automatically (mDNS) — no IP configuration.

Four machines at a glance: this Mac, an RTX 3090 box at 97 % and 335 W, a Synology NAS and a cloud droplet. Each tile pairs GPU + VRAM and CPU + RAM on one axis, plus ANE + memory bandwidth on Apple Silicon — the tinted metric word matches its line, so no legend is needed. A tile ends with what the box runs: the GPU box has 2 models and 3 containers, 1 restarted (in amber), the droplet 8 containers. This Mac is always the first tile.
- A remote Mac renders in the exact dashboard the local one uses — E/P cores, GPU, ANE, Media, memory bandwidth, power, fans. As far as I know, no other tool shows a remote Mac's Neural Engine.
- A Linux/NVIDIA box gets a GPU-centric view — utilization, VRAM, power against the card's limit, temperature, and the questions asked of Apple Silicon: is it bandwidth-bound, how close are the clocks to their maximum, and what is holding them back (power cap, thermal slowdown). Then what runs on it: which processes hold VRAM, named by script and container, the Ollama models, a ComfyUI queue, and the containers with their restart counts. It doesn't pretend a 3090 has E-cores.
- A server without a GPU — a cloud droplet running Docker — shows its containers, CPU, memory and disks, and can be read without handing the agent root.

A headless M1 Air, seen from another Mac: 4E+4P cores, GPU/Media/ANE est., the real memory split (wired 1.0 / active 2.7 / compressed 0.5 GB, pressure 19%) — and Sensors correctly reporting fanless instead of inventing a fan reading. Cards a wire agent can't fill are omitted, not faked.

The same app, a different machine class. An RTX 3090 at 305 / 390 W, and why it runs as it does:
memory bandwidth 43 % busy, core clock 1920 of 2130 MHz at P2, nothing holding the clocks
back. Who holds the VRAM is named by script — whisper-bench 5.2 GB, ComfyUI 0.2 GB — beside
the ComfyUI queue, the Ollama models on disk, and the containers, where one that reads "Up 3
minutes" has in fact restarted 485 times. No E-cores, no ANE — because it has neither.

A 2-vCPU cloud droplet, reached over Tailscale. With no GPU, the page starts with what it runs — eight containers, read through a read-only Docker proxy so the agent never holds root — then CPU, memory and disks. Setting one up: the Fleet manual.
Every connection is TLS-encrypted and token-authenticated, and the viewer pins the agent's certificate the first time it connects, so a re-keyed or spoofed agent is refused rather than silently trusted.

Nothing about single-Mac use changes — the dashboard is the same one, with a collapsible Devices sidebar added. Collapse it and you're back to 3.x exactly.
Install an agent
One command, the same on Linux and macOS:
curl -fsSL https://raw.githubusercontent.com/kennss/SiliconScope/main/scripts/install-agent.sh | sh
It ends by printing one sscope://pair… link — paste it into Add machine… in the app and the
machine is added and paired in a single step. On a Mac you sit at, you don't need the agent at
all: Settings → Share this Mac to Fleet.
📖 Fleet manual — headless Macs, Linux GPU boxes, a cloud server over Tailscale without handing the agent root, Intel Macs, Windows, changing a token, removing an agent, and what to do when a machine doesn't connect.
New in 3.0
🧠 Process Inspector — per-process metrics, sudoless
Click any process to open the Inspector. It shows what Activity Monitor can't: CPU (P/E split) · IPC · per-process power (W) · memory · disk — each with a live sparkline — and the one signal nobody else surfaces per process: Neural-Engine memory. See exactly which app is on the ANE, and how much it's holding.

An on-device transcription app running live (right): 65% CPU at 2.43 IPC, 0.64 W, and 762 MB of Neural-Engine memory — the ANE footprint no other monitor shows per process. Accelerators that macOS only reports system-wide (GPU / ANE-power / Media / bandwidth) are labeled as such — no faked per-process numbers.
⏺ Record & Replay — a DVR for your Mac's metrics
Hit Record and SiliconScope streams every metric — CPU, GPU, ANE, Media, bandwidth, power,
sensors, processes — to a compact .ssrec file. Then replay the whole dashboard with
play / pause / scrub / speed, so you can catch a spike that's already gone by the time you
look at it. It all stays on your Mac; export a recording to share or diff a run later.

The Replay transport: play / pause / step, scrub the timeline, change speed, and Save the recording.
Why I built it
I built SiliconScope while developing Spectalo, an on-device AI video player. To see how it was actually driving the chip, I ended up running two monitors at once — and neither one fit:
- asitop / NeoAsitop had the chip-level numbers, but the TUI was rough to look at and thin on detail.
- btop was gorgeous and dense, yet blind to exactly what I needed — ANE (Neural Engine), the Media Engine, and memory bandwidth.
Keeping both open side by side was painful, and a waste of screen space. I started to fork NeoAsitop and btop to patch the gaps — then decided to do it properly instead: one native, good-looking GUI that surfaces the Apple-Silicon-specific signals and that a normal person, not just a terminal dweller, can actually read.
So I built it.
And once it existed, I realized it was finally time to part with iStat Menus — my daily monitor for years. That's what 2.0 is: the release where SiliconScope grew the full menu-bar suite, per-unit sensors, and battery health it needed to take iStat's place on my own Mac.
Install
Homebrew — the easiest way:
brew install --cask siliconscope
Or grab the DMG: ⬇ Download the latest DMG, then:
- Open the downloaded
SiliconScope-*.dmg - Drag SiliconScope into Applications
- Launch it
Signed with a Developer ID and notarized by Apple — it opens with no Gatekeeper prompt. Requires macOS 14+ on Apple Silicon. It updates itself from here on (Sparkle) — this is the last DMG you download by hand.
Pre-release macOS is not supported. This project has one Mac and it runs the release version, so a developer beta cannot be reproduced or verified here. Reports from one are still welcome and have already been useful — SiliconScope reads private IOReport interfaces that Apple renames between builds, and a rename found early is a rename fixed before it reaches everyone — but fixes land when the OS ships, not against a beta seed.
Prefer to build it yourself? See Build & run.
Highlights
- Process Inspector (new in 3.0) — focus one process for CPU (P/E split), IPC, per-process power (W), memory, disk, and Neural-Engine memory — all sudoless
- Record & Replay (new in 3.0) — record every metric to a
.ssrecfile and replay the dashboard with play / pause / scrub / speed, like a DVR - AI Workload view — a bottleneck classifier (bandwidth-bound / compute-bound / thermal-throttled / memory-pressured), judged against each chip's spec bandwidth ceiling — answers "what's limiting my local LLM right now?"
- E-core / P-core split — per-cluster utilization + real DVFS frequency
- GPU — utilization, power, frequency
- ANE & Media Engine — Neural-Engine activity (measured cluster residency), power and memory traffic, plus media-codec bandwidth (the differentiators)
- Memory bandwidth — CPU / GPU / Media / ANE / total GB/s (the local-LLM bottleneck signal)
- Memory — Wired / Active / Compressed / Free stacked bar + macOS memory-pressure alerts
- Network ↑/↓ and Disk read/write + free space, with live graphs
- Per-unit temperatures — real E-Core / P-Core / GPU / Memory sensors via curated per-generation SMC keys (M1–M5; HID fallback on others), fan RPM, thermal pressure, and GPU throttle detection (clock held below its rolling peak under pressure)
- Battery — charge state, health %, cycle count, condition (AppleSmartBattery)
- Power — per-domain CPU / GPU / ANE / DRAM / SoC, plus battery
- Processes — sort, filter, kill, and click to inspect (in-card scroll)
- Per-metric menu-bar items — pin CPU / GPU / Memory / Network / SSD / Sensors / Battery each to its own menu-bar glyph + dropdown (plus the combined "SS" cockpit glyph)
- Auto-update — built-in Sparkle updater; "Check for Updates…" in the menu
- No
sudorequired.
Build & run
Requires macOS on Apple Silicon and the Xcode toolchain.
xcrun swift run SiliconScope        # SwiftUI GUI (dashboard + menu bar)
xcrun swift run -q sscope-cli       # data-layer verification CLI
xcrun swift build                   # build everything
scripts/build-app.sh                # create dist/SiliconScope.app locally
open dist/SiliconScope.app          # launch the local app bundle
Use
xcrun. A non-Xcodeswift(e.g. swiftly) may not match the macOS SDK and will fail withFailed to build module 'Foundation'.
The measurement layer is a Swift library, SiliconScopeCore, and it can be linked into your own
tool. See Using SiliconScopeCore as a library. It is not a stable API.
How it works (all sudoless)
| Data | Source |
|---|---|
| Power (CPU/GPU/ANE/DRAM), residency, memory bandwidth | private IOReport framework (symbols resolved at runtime via dyld) |
| CPU usage | host_processor_info ticks (matches Activity Monitor) |
| CPU/GPU frequency | IOReport CPU Stats / GPU Stats × IORegistry DVFS table |
| Memory / swap / pressure | host_statistics64, sysctl |
| Temperatures (per-unit) | curated per-generation SMC FourCC keys + HID (IOHIDEventSystem) fallback |
| Fans, thermal pressure | SMC via IOKit |
| Network / Disk | getifaddrs / SystemConfiguration, mounted-volume capacities |
| Battery (charge + health/cycles/condition) | IOPowerSources + AppleSmartBattery (IORegistry) |
| Processes | libproc |
Verified IOReport channel map: docs/ioreport-channels.md.
Display spec: docs/display-spec.md.
Deep dive — the hard parts
Most of these are private/undocumented APIs with no SDK stub. The patterns below are the reason people clone this repo — each one is a gotcha that cost a day to figure out.
1. IOReport without sudo — and without an SDK stub
IOReport carries the good stuff (per-domain power, cluster residency, memory bandwidth) and
needs no root. The catch: there's no .tbd stub in the SDK, so -framework IOReport
fails to link. The fix is to declare the symbols yourself and let dyld resolve them from
the shared cache at runtime:
// Package.swift — link the final binary with dynamic_lookup
linkerSettings: [.unsafeFlags(["-Xlinker", "-undefined", "-Xlinker", "dynamic_lookup"])]
// Sources/CIOReport/include/ktop_ioreport.h — your own extern decls (one isolated C target)
extern CFDictionaryRef IOReportCreateSamples(IOReportSubscriptionRef, CFMutableDictionaryRef, CFTypeRef);
extern CFDictionaryRef IOReportCreateSamplesDelta(CFDictionaryRef prev, CFDictionaryRef cur, CFTypeRef);
Sampling is two snapshots a short interval apart (~175 ms), then …SamplesDelta — power
and residency are deltas, not instantaneous values. All private declarations live in one C
target (CIOReport) so the unsafe surface is contained and the Swift side stays clean.
Trade-off: private API ⇒ no App Store sandbox. Self-distribute (sign + notarize). The
dynamic_lookupflag is broad — it defers all undefined symbols to runtime, so a real link typo only surfaces on launch. Worth knowing.
2. Per-unit temperatures: curated SMC keys, HID fallback
On Apple Silicon a naive SMC "scan all T… keys" returns almost nothing useful, and the HID
sensor set (IOHIDEventSystemClient, PrimaryUsagePage 0xff00 / usage 5) returns many
sensors but with cryptic PMU names (PMU tdie3, tcal). iStat-style friendly names come from
a hand-curated, per-generation map of SMC FourCC keys read directly (not scanned):
// SensorCatalog.swift — detected from the CPU brand string (M1…M5)
cpu([("Tp09","E-Core 1"), ("Tp01","P-Core 1"), ("Tp05","P-Core 2"), …]) +
gpu([("Tg05","GPU 1"), …]) + mem([("Tm02","Memory 1"), …])
The keys are near-arbitrary and change every generation (tables adapted from Stats). Fallback chain: curated SMC → HID set → SMC scan (Intel). Variants (Pro/Max/Ultra) need no special-casing — absent keys simply don't read back and are skipped.
3. E/P-core split + real DVFS frequency
Topology from sysctl hw.perflevel0/1; per-core utilization from host_processor_info ticks
(the same source Activity Monitor uses). Frequency is residency-weighted: IOReport gives time
spent in each DVFS state, and the state→MHz table comes from IORegistry (voltage-states*),
so the reported MHz is what the cluster actually ran at, not a nominal max.
4. ANE & memory bandwidth (with an honest caveat)
The IOReport Energy Model group exposes per-domain power including the Neural Engine, and
the bandwidth channels give CPU/GPU/Media/ANE/total GB/s. ANE activity is measured, not inferred
from power: SoC Stats › Cluster Power States reports how long each ANE cluster spent active, and
the gauge is the busiest cluster's share. That is a share of time, not a count of operations —
Apple still doesn't expose ANE occupancy — but it is a measurement, and it stays live on macOS 27,
where some chips update the Energy Model counters only at power-management events (about every
30 minutes on an M1 Max). There, ANE watts are an average over that span and are labelled as
one. On a Mac without the residency channel the gauge falls back to power against its observed
peak.
5. Dynamic per-metric menu-bar items (AppKit, not SwiftUI)
Each metric becomes its own menu-bar item you can toggle. SwiftUI's MenuBarExtra can't do
this: a conditional scene won't compile (SceneBuilder has no buildOptional), and
MenuBarExtra(isInserted:) triggers a main-menu update loop (beachball). The working
answer is AppKit — an NSStatusItem + NSPopover per enabled metric, reconciled against the
toggles each tick. Live glyphs are drawn to NSImage (a live SwiftUI label: collapses to
zero width in a status item).
6. Auto-update in a pure-SPM app
Sparkle via SPM, with no Xcode project: package.sh embeds Sparkle.framework, fixes the
rpath, signs nested helpers deep→shallow, then runs generate_appcast. The feed is the
latest GitHub release's appcast.xml (…/releases/latest/download/appcast.xml), so each
release just attaches the DMG + appcast and the app updates itself.
7. Per-process metrics — including ANE memory — without sudo
The Process Inspector's numbers come from proc_pid_rusage(pid, RUSAGE_INFO_V6, …) — a
public SDK call (no entitlement, no root for processes you own). rusage_info_v6 carries far
more than CPU time: ri_instructions / ri_cycles (real IPC), ri_energy_nj (per-process
power, in nanojoules), ri_user_ptime (the P-core share), disk bytes, wakeups — and the
one that matters most here, ri_neural_footprint: per-process Neural-Engine memory. That's
the only genuinely per-process ANE signal Apple exposes, so the Inspector shows ANE memory per
app but keeps GPU / ANE-power / Media / bandwidth labeled system-wide (Apple doesn't
attribute those to a pid — and faking it would be worse than honest). Counters are turned into
rates by delta-over-dt between ticks; a ri_proc_start_abstime check guards against pid reuse.
Not on the Mac App Store
SiliconScope uses private (un-entitled) APIs (IOReport, SMC, HID), so it cannot be sandboxed/notarized for the App Store. Distribute directly. This is the same trade-off as NeoAsitop, macmon, mactop, and Stats.
Contributing
PRs welcome — see CONTRIBUTING.md. The most useful contribution right now:
verify the per-chip temperature keys. The M1 table is hardware-validated; M2–M5 are
adapted but unverified. On an M2/M3/M4/M5, run xcrun swift run -q sscope-cli --sensors
(+ sysctl hw.model machdep.cpu.brand_string) and open an issue with the output.
Related
Spectalo — a beautiful video player with on-device AI subtitles & translation (Whisper + Apple Intelligence), from the same lab (Calida Lab). SiliconScope was born from building it. Free open beta on TestFlight — same ethos: nothing leaves your device.
More from Calida Lab
Privacy-first, on-device software — mostly for Apple Silicon:
- SpectaLing — on-device transcription + live translation & interpretation (Mac/iPad). A privacy-first MacWhisper alternative.
- SpectArk — realtime, versioned backup for the Mac folders you care about: every change saved within seconds, Time Machine–style restore points, to any disk or NAS.
- SpectaBooks — one reader for the books you already have: text, EPUB, PDF and comics from your own folders, iCloud Drive or Google Drive, with your place synced across iPhone, iPad and Mac, and on-device read-aloud and translation.
- SnowChat — end-to-end encrypted messenger on our own Signal-protocol library.
- SnowClaw — a reference architecture for privacy-preserving agentic AI (working paper).
Acknowledgements
Contributors
Most of the chips SiliconScope reads correctly are chips it has never run on. This project owns one M1 Max; M2 Max, M4 Max, M5 Max and Intel support exist because people measured on their own hardware carefully enough that nothing had to be guessed. Others wrote parts of the app outright — the name, the AI-workload classifier, the Windows agent — or found numbers that were wrong without looking wrong.
👥 Everyone who made it, and what each of them did
- IOReport / SMC / HID sensor knowledge referenced from NeoAsitop (MIT) and SocPowerBuddy; the per-generation SMC temperature key→name tables are adapted from Stats (MIT). The data layer is written from scratch — declarations/facts referenced, no code copied.
- Auto-update by Sparkle.
- Design language inspired by btop.
- Further reading on why local LLMs run on the GPU (Metal) rather than the ANE — the very distinction SiliconScope's AI view is built around: muramoto's measured deep-dive on the ANE for LLM inference (Japanese, Zenn) — shows the ANE wins for small fixed-shape models (Whisper, ViT, embeddings) but loses to the GPU on 4B+ LLMs. Shared by @KoheiKanagu
License
MIT © 2026 Kennt Kim — see LICENSE.
The SiliconScope name and app icon are not covered by the MIT license. If you distribute a modified version, please give it a different name and icon.

btop
aristocratos·C++
终端里的资源监控工具,实时显示 CPU、内存、磁盘、网络和进程占用,界面美观、操作顺手,适合在服务器或本地随时查看系统状态。
系统监控+4系统监控
35322+371.3kv1.4.82026-11-10 09:30 UTC

vorssaint-utils
vorssaint·Swift
一款免费开源的 macOS 菜单栏工具箱,把窗口切换、应用卸载、访达增强、防休眠等常用小功能集中到菜单栏,省去装一堆零散工具。
菜单栏工具+4系统监控
33963+5581.7kv3.4.32026-11-10 03:38 UTC
hyperfine
sharkdp·Rust
命令行基准测试工具,能对任意 shell 命令做多次运行统计,自动给出耗时分布和置信区间,方便比较不同实现的性能差异。
基准测试+3系统监控
29235+10641v2.0.02026-11-01 03:02 UTC

systeminformer
winsiderss·C
一款免费强大的系统监控与调试工具,可实时查看进程、性能、网络等资源占用,还能辅助排查恶意软件。
系统监控+4系统监控
16463+251.8kv4.0.26241.1382026-11-10 09:38 UTC